


How the Economy Really Works- Inflation, Money Supply and the Velocity of Money
Economics / Money Supply Apr 26, 2008 - 07:54 AM GMTBy: John_Mauldin

 The Velocity Of Money
 - Is the Money Supply Growing or Not?
- P=MV
- A Slowdown in Velocity
- If You Are in a Hole, Stop Digging
- And More Write-offs to Come
The late and great Milton Friedman told us that inflation is always and everywhere a monetary phenomenon. But there is an asterisk to his equation that we need to examine, namely, the velocity of money. Sometimes a fast-growing money supply is not as inflationary as you might think. Then we will take quick looks at why the banking sector is in for more and larger rounds of write-offs, as well as note that the housing industry is in a hole but is gamely digging itself deeper. This week's letter will require you to put your thinking cap on as we travel to a mythical island to get an understanding of how the economy really works. There are a lot of charts, so the letter may again print long, but the word length is normal. And with no "but first," we jump right in.
When most of us think of the velocity of money, we think of how fast it goes through our hands. I know at the Mauldin household, with seven kids, it seems like something is always coming up. And with my oldest daughter Tiffani getting married this summer (forget gas, you haven't seen inflation until you start buying floral arrangements), more kids in school, "Dad, I need a car," high energy costs, etc., the velocity, at least in terms of how fast money seems to go out the door, seems faster than normal. And what about my business? Travel costs are way, way up, and as aggressive as we are on the budget, expenses seem to rise. About the only way to deal with it is, as my old partner from the 1970's Don Moore used to say, is to make it up with "excess profits," whatever those are.
Is the Money Supply Growing or Not?
But we are not talking about our personal budgetary woes, gentle reader. Today we tackle an economic concept called the velocity of money and how it affects the growth of the economy. But let's start with a few charts showing the recent and high growth in the money supply that many are alarmed about. The money supply is growing very slowly, alarmingly fast or just about right, depending upon which monetary measure you use.
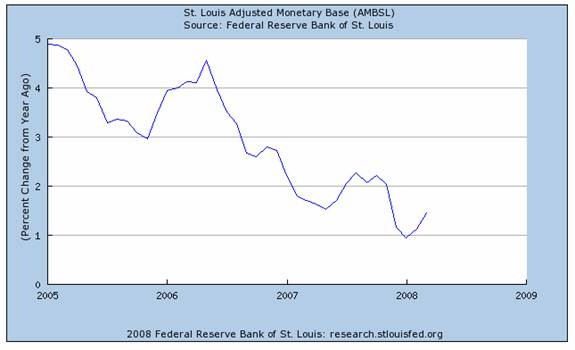
First, let's look at the adjusted monetary base, or plain old cash plus bank reserves held at the Federal Reserve. That is the only part of the money supply the Fed has any real direct control of. And it is not growing that much (less than 2%!), and a lot of the cash goes overseas, never to come back to the US. Also note that the growth in the monetary base has been trending down until recently.
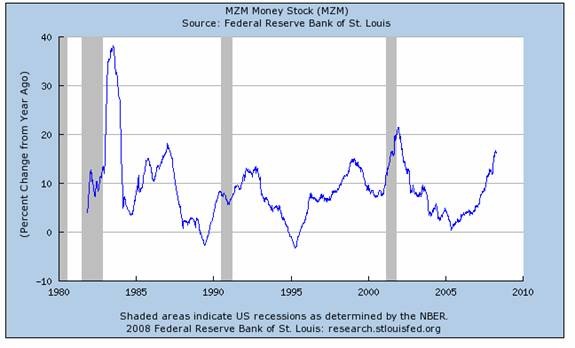
Next, let's look at MZM, or Money of Zero Maturity. Stated another way, you can think of it as cash, whether in a bank, a money market fund or in your hands.
Now, remember, Friedman taught us that inflation is a monetary phenomenon. If you increase the money supply too fast, you risk an unwanted rise in inflation. If the money supply shrinks or grows too slowly, you could see deflation develop.
Note that MZM is growing at close to an 18% rate year over year. Also note that less than three years ago MZM was growing close to zero. Since that time inflation has increased. Therefore, one could make the case that the Fed is causing inflation by allowing the money supply to increase too rapidly. Case closed.
Or maybe not. More cash sometimes means that people and businesses are taking less risk. The Fed cannot control what we do with our money, only how much bank reserves it allows and how much cash it puts into the system.
Forecasting inflation from a money supply graph is very difficult. It used to be a lot simpler, but in recent decades has been very unreliable, for reasons we will look at in a moment. But it is much too simplistic to draw a direct comparison to inflation and an arbitrary money supply measure.
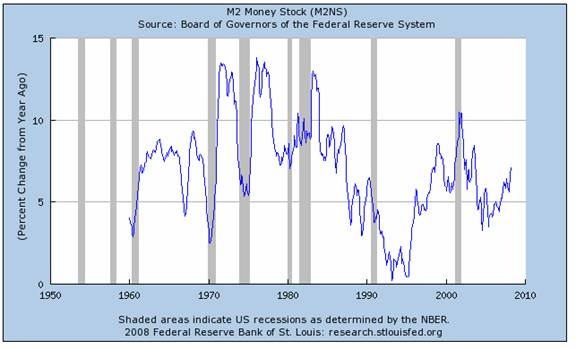
If we look at a graph of M2, which includes time deposits, small certificates of deposit, etc. we again see a rise in recent growth. M2 is the measure of money supply that most economists use when they are thinking about inflation. And we see that M2 is growing at a sprightly 7% year over year. This is not all that high historically, but again it is up significantly over the past few years. See the graph below. Note there have been several times (as recently as 2000) when annual M2 growth was over 10%.
I should note that M2 has been growing at 12% since the first of the year, so there is an acceleration in growth, which some find a major concern. If that pace were to continue, maybe we should worry, but M2 growth is quite erratic from quarter to quarter. In any event, there is another factor we need to consider besides the money supply.
The Velocity of Money
Now, let's introduce the concept of velocity of money. Basically, this is speaking of the average frequency with which a unit of money is spent. Let's assume a very small economy of just you and me, which has a money supply of $100. I have the $100 and spend it to buy $100 of flowers from you. You in turn spend $100 to buy books from me. We have created $200 of our "gross domestic product" from a money supply of just $100. If we do that transaction every month, we would have $2400 of "GDP" from our $100 monetary base.
So, what that means is that gross domestic product is a function of not just the money supply but how fast the money supply moves through the economy. Stated as an equation, it is P=MV, where P is the Nominal Gross Domestic Product (not inflation adjusted here), M is the money supply and V is the velocity of money. You can solve for V by dividing P by M.
Now, let's complicate our illustration just a bit, but not too much at first. This is very basic, and for those of you who will complain that I am being too simple, wait a few pages, please. Let's assume an island economy with ten businesses and a money supply of $1,000,000. If each business does approximately $100,000 of business a quarter, then the Gross Domestic Product for the island would be $4,000,000 (4 times the $1,000,000 quarterly production). The velocity of money in that economy is 4.
But what if our businesses got more productive? We introduce all sorts of interesting financial instruments, banking, new production capacity, computers, etc., and now everyone is doing $100,000 per month. Now our GDP is $12,000,000 and the velocity of money is 12. But we have not increased the money supply. Again, we assume that all businesses are static. They buy and sell the same amount every month. There are no winners and losers as of yet.
Now let's complicate matters. Two of the kids of the owners of the businesses decide to go into business for themselves. Having learned from their parents, they immediately become successful and start doing $100,000 a month themselves. GDP potentially goes to $14,000,000. In order for everyone to stay at the same level of gross income, the velocity of money must increase to 14.
Now, this is important. If the velocity of money does not increase, that means that (in our simple island world) on average each business is now going to buy and sell less each month. Remember, nominal GDP is money supply times velocity. If velocity does not increase, GDP will stay the same. The average business (there are now 12) goes from doing $1,200,000 a year down to $1,000,000.
Each business now is doing around $80,000 per month. Overall production is the same, but divided up among more businesses. For each of the businesses, it feels like a recession. They have fewer dollars so they buy less and prices fall. So, in that world, the local central bank recognizes that the money supply needs to grow at some rate in order to make the demand for money "neutral."
It is basic supply and demand. If the demand for corn increases, the price will go up. If Congress decides to remove the ethanol subsidy, the demand for corn will go down as will the price.
If the central bank increases the money supply too much, you would have too much money chasing too few goods and inflation would manifest its ugly head. (Remember, this is a very simplistic example. We assume static production from each business, running at full capacity.)
Let's say the central bank doubles the money supply to $2,000,000. If the velocity of money is still 12, then the GDP would grow to $24,000,000. That would be a good thing, wouldn't it?
No, because we only produce 20% more goods from the two new businesses. There is a relationship between production and price. Each business would now sell $200,000 per month or double their previous sales, which they would spend on goods and services which only grew by 20%. They would start to bid up the price of the goods they want and inflation sets in. Think of the 1970's.
So, our mythical bank decides to boost the money supply by only 20%, which allows the economy to grow and prices to stay the same. Smart. And if only it were that simple.
Let's assume 10 million businesses, from the size of Exxon down to the local dry cleaners and a population which grows by 1% a year. Hundreds of thousands of new businesses are being started every month and another hundred thousand fail. Productivity over time increases, so that we are producing more "stuff" with fewer costly resources.
Now, there is no exact way to determine the right size of the money supply. It definitely needs to grow each year by at least the growth in the size of the economy, new population and productivity or deflation will appear. But if money supply grows too much then you would have inflation.
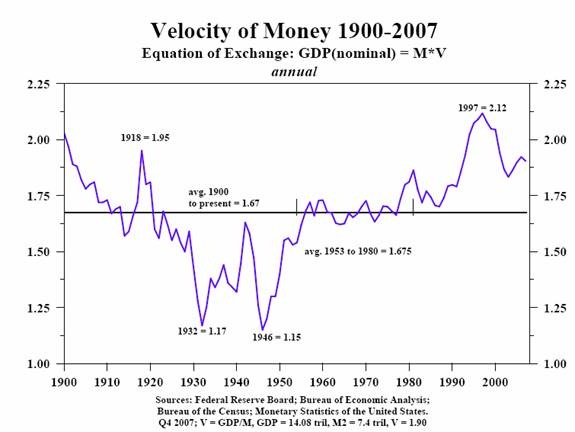
And what about the velocity of money? Friedman assumed the velocity of money was constant. And it was from about 1950 until 1978 when he was doing his seminal work. But then things changed. Let's look at two charts sent to me by Dr. Lacy Hunt of Hoisington Investment Management in Austin, and one of my favorite economists. First, let's look at the velocity of money for the last 108 years.
Notice that the velocity of money fell during the Great Depression. And from 1953 to 1980 the velocity of money was almost exactly the average for the last 100 years. Also, Lacy pointed out in a conversation which helped me immensely in writing this letter, that the velocity of money is mean reverting over long periods of time. That means one would expect the velocity of money to fall over time back to the mean or average. Some would make the argument that we should use the mean from more modern times since World War 2, but even then, mean reversion would mean a slowing of the velocity of money (V) and mean reversion implies that V would go below (over-correct) the mean. However you look at it, the clear implication is that V is going to drop. In a few paragraphs, we will see why that is the case from a practical standpoint. But let's look at the first chart.
Now, let's look at the same chart since 1959 but with shaded gray areas which show us the times the economy is in recession. Note that (with one exception in the 1970s) velocity drops during a recession. What is the Fed response? An offsetting increase in the money supply to try and overcome the effects of the business cycle and the recession. P=MV. If velocity falls then money supply must rise for nominal GDP to grow. The Fed attempts to jump start the economy back into growth by increasing the money supply.
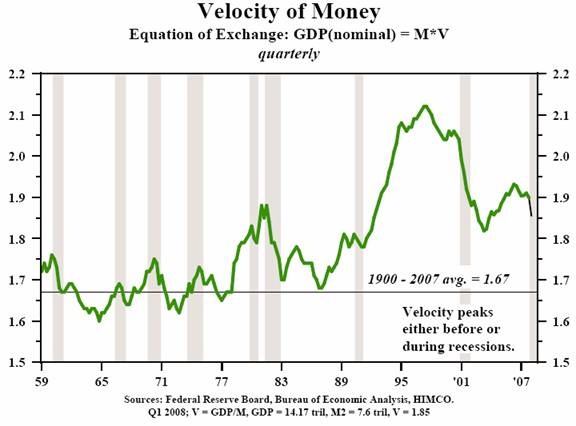
In this chart, Lacy assumes we are already in recession (gray bar at far right). The black line is his projection of velocity in the near future. If you can't read the print at the bottom of the chart, he assumes that GDP is $14.17 trillion, M2 is $7.6 trillion and therefore Velocity is 1.85, down from almost 1.95 just a few years ago. If velocity reverts to or below the mean, it could easily drop 10% from here. We will explore why this could happen in a minute.
P=MV
But let's go back to our equation, P=MV. If velocity slows by 10% (which it well should) then money supply (M) would have to rise by 10% just to maintain a static economy. But that assumes you do not have 1% population growth, 2% (or thereabouts) productivity growth, a target inflation of 2%, which means M (money supply) needs to grow about 5% a year even if V was constant. And that is not particularly stimulative, given that we are in recession.
Bottom line? Expect money supply growth well north of 7% annually for the next few years. Is that enough? Too much? About right? We won't know for a long time. This will allow arm chair economists (and that is most of us) to sit back and Monday morning quarterback for many years.
A Slowdown in Velocity
Now, why is the velocity of money slowing down? Notice the real rise in V from 1990 through about 1997. Growth in M2 (see the above chart) was falling during most of that period, yet the economy was growing. That means that velocity had to rise faster than normal. Why? Primarily because of the financial innovations introduced in the early 90's like securitizations, CDOs, etc. It is financial innovation that spurs above trend growth in velocity.
And now we are watching the Great Unwind of financial innovations, as they went to excess and caused a credit crisis. In principle, a CDO or subprime asset backed security should be a good thing. And in the beginning they were. But then standards got loose, greed kicked in and Wall Street began to game the system. End of game.
What drove velocity to new highs is no longer part of the equation. Its absence is slowing things down. If the money supply did not rise significantly to offset that slowdown in velocity the economy would already be in a much deeper recession.
While the Fed does not have control over M2, when they lower interest rates, it is supposed to make us want to take on more risk, borrow money and boost the economy. So, they have an indirect influence.
I expect the Fed to cut another 25 basis points next week, and to give us a statement that will look neutral, with a nod toward difficult economic conditions. The latest Beige Book from the Fed was simply dreadful, so you can bet the governors will have a deteriorating economy in mind. Given the 25 plus year low in consumer confidence, they have little choice.
But the difference another 50 basis point cut (over the next few meetings) would make is not all that much. A 2% rate is already low. That would make the real rate (after inflation) negative. In one sense, 2% today is lower in real (inflation adjusted) terms than the 1% that Greenspan took it to. Back then inflation was just above 1%. We will have a negative real interest rate after this next cut. Depending upon which inflation measure you use (and there are a few with some wide differences), it could be as much as 2% negative. Now that is REAL stimulus.
And since we are on asides, let me predict that the official GDP for the first quarter will not be negative. You watch and see if the PCE deflator is below 3%. Call me cynical, but it would not surprise me, even as CPI is over 4%. Also, watch GDP get revised to negative next year.
If You Are in a Hole, Stop Digging
I often listen to CNBC when I am driving to work (if I am not on the phone). I am amazed how often I hear (or read) about the bottom of the housing market. Often we hear that the stock market is predicting the bottom. I wonder if any of these cheerleaders actually looks at the relevant statistics. Again, let's do some basic arithmetic so that even an analyst can understand.
Yesterday we found out that new home sales are running at an annual rate of 526,000, the lowest number in almost two decades. The supply of new homes, in terms of the amount of time it would take to work through the inventory available for sale was 8.4 months last October. It is now an even 11 months. (source for data: www.weldononline.com )
How many homes did the home building industry start building last month? Housing starts were running at an annual rate of 947,000. Permits for new homes was 927,000. That means the industry is building over 400,000 more homes than they are selling. Add in a million or so foreclosures. Kill the subprime market. Really make it hard to get a loan securitized for anything but government backed mortgages.
Home construction is going to drop precipitously before the inventory of new homes is worked through. Those who are predicting a rebound this quarter are simply not paying attention to the basic math. New home prices are down 13.3% year over year. They are going much lower. Margins are going to get squeezed. Now maybe the market is pricing all this in. But I think there are better places to gamble than the home builders.
And More Write-offs to Come
And speaking of gambling, a few quick thoughts on the write-offs that we are seeing in the banking industry. We have just seen the beginning of woes. We are nowhere near close to the end, for three reasons. First, the estimated amount of write-offs from the subprime crisis is now approaching $1 trillion (courtesy of the IMF). We have seen (maybe) write-offs of about $250 billion. Where is the other $750 billion?
Now, some of it – maybe even most of it - is in insurance companies, pension funds and sovereign wealth funds. It will be years before we can even estimate how much. There will be no press releases from the Central Bank of China saying they are writing off $15 billion. Which pension fund investment committee will announce their losses? We will only "see" it in lower performance numbers.
But a lot is still in the banking system, having yet to be downgraded by the rating agencies.
Secondly, the problems are spreading from subprime. Bill King called my attention to this note from Housingwire.com. Quote (emphasis mine):
"Moody's Investors Service issued more Alt-A downgrades on Thursday morning, this time taking a heavy hand to 32 different Aaa-rated tranches from 10 different Alt-A deals. Many of the downgrades even pushed former Aaa's into non-investment grade categories - a stunning descent for top-rated Alt-A mortgage bonds that underscores two key points.
"First, defaults are obviously accelerating. Second, many Alt-A deals were issued with less in the way of overcollateralization - which, in plain English, means that these deals will start to see downgrades sooner, compared to the relative stress that a typical subprime RMBS deal can withstand before the hits start coming at the Aaa level.
" The rating agency placed an additional 254 Aaa-rated Alt-A classes on negative ratings watch Wednesday."
Clearly the default disease is moving up into Alt-A loans. Do you think any bank has written these loans off yet? There are more write-offs coming from the mortgage space. It is not unrealistic that we could see as much (in total) as we have already seen.
Third, we are in a recession. That means all sorts of business loans, commercial real estate, credit cards, student loans, car loans and so on are yet to default. Defaults on such loans are a lagging indicator. Those write-offs occur closer to the end of the recession than the beginning and we have not seen much of them yet. We will. Expect banks to continue to post ever larger reserves for losses.
All in all, we are nowhere close to the bottom of the credit crisis. The cycle of large write-downs and then going to the market for more capital is going to continue for some time, perhaps longer than a year. Anyone who is putting money in the financial stocks is gambling, not investing.
South Africa, La Jolla, Toronto and Maine
Next Saturday I leave for South Africa. I am not looking forward to a 14 hour flight in coach, but I always enjoy South Africa. (South African Airways executives take note: I will be glad to testify to the comforts of first class for an upgrade!) I am there about ten days and then head back, going back to La Jolla for a quick trip to meet with my partners at Altegris and Thomas Fischer of Jyske Bank.
Tiffani committed me to a speech in Toronto mid-June, and in late July I will go to Maine to go fishing with my youngest son at David Kotok's annual fishing fest sometimes called the Shadow Fed.
Then the big event. Tiffani is getting married on 08-08-08. It is going to be quite the production. Every table is its own work of art. The cake will look like an old sculpture with vines all around it. Of course, everything has its own significance. And the photography that has already been done is way over the top.
As noted above, I am flabbergasted at the cost of flowers. And fireworks? In downtown Dallas? I have three other daughters, who I am sure will all be watching and taking notes. Guess it is good I have no plans to retire in the next 20 years. It seems Dad is going to be working and traveling for a long time.
The twins are coming down this weekend, so all seven kids will be around. I am looking forward to it. And the Rangers are playing outside my window, trying to keep from losing 8 straight. They have already set the team record for worst April, and there are six games to go. And the Mavericks are down to New Orleans. Isn't it time for some Dallas Cowboy football?
Have a great week, and remember times with family and friends go by fast, so enjoy all that velocity while you can.
Your watching the velocity of life pick up speed analyst,
By John Mauldin
John Mauldin, Best-Selling author and recognized financial expert, is also editor of the free Thoughts From the Frontline that goes to over 1 million readers each week. For more information on John or his FREE weekly economic letter go to: http://www.frontlinethoughts.com/learnmore
To subscribe to John Mauldin's E-Letter please click here:http://www.frontlinethoughts.com/subscribe.asp
Copyright 2008 John Mauldin. All Rights Reserved
John Mauldin is president of Millennium Wave Advisors, LLC, a registered investment advisor. All material presented herein is believed to be reliable but we cannot attest to its accuracy. Investment recommendations may change and readers are urged to check with their investment counselors before making any investment decisions. Opinions expressed in these reports may change without prior notice. John Mauldin and/or the staff at Millennium Wave Advisors, LLC may or may not have investments in any funds cited above. Mauldin can be reached at 800-829-7273.
Disclaimer PAST RESULTS ARE NOT INDICATIVE OF FUTURE RESULTS. THERE IS RISK OF LOSS AS WELL AS THE OPPORTUNITY FOR GAIN WHEN INVESTING IN MANAGED FUNDS. WHEN CONSIDERING ALTERNATIVE INVESTMENTS, INCLUDING HEDGE FUNDS, YOU SHOULD CONSIDER VARIOUS RISKS INCLUDING THE FACT THAT SOME PRODUCTS: OFTEN ENGAGE IN LEVERAGING AND OTHER SPECULATIVE INVESTMENT PRACTICES THAT MAY INCREASE THE RISK OF INVESTMENT LOSS, CAN BE ILLIQUID, ARE NOT REQUIRED TO PROVIDE PERIODIC PRICING OR VALUATION INFORMATION TO INVESTORS, MAY INVOLVE COMPLEX TAX STRUCTURES AND DELAYS IN DISTRIBUTING IMPORTANT TAX INFORMATION, ARE NOT SUBJECT TO THE SAME REGULATORY REQUIREMENTS AS MUTUAL FUNDS, OFTEN CHARGE HIGH FEES, AND IN MANY CASES THE UNDERLYING INVESTMENTS ARE NOT TRANSPARENT AND ARE KNOWN ONLY TO THE INVESTMENT MANAGER.
John Mauldin Archive |
© 2005-2022 http://www.MarketOracle.co.uk - The Market Oracle is a FREE Daily Financial Markets Analysis & Forecasting online publication.