


Crude Oil Price Higher Short-Term, Lower Longer-Term?
Commodities / Crude Oil Jun 23, 2014 - 03:57 PM GMTBy: Nadia_Simmons

 On Friday, crude oil gained 0.54% as ongoing worries over the potential of supply disruptions from Iraq continued to weigh on the price. As a result, light crude climbed above the resistance line, invalidating earlier breakdown. Will this bullish factor trigger further improvement in the short term?
As you know from our previous Oil Trading Alerts, the key factor that has driven the price of crude oil in recent days was the deteriorating situation in Iraq. Therefore, news that the conflict between Sunni Islamist insurgents and Iraqi army forces continued to push the commodity higher also on Friday. Please note that although active oilfields remain far south from the insurgency, concerns about potential supply disruptions still support the price. Where crude oil head next? Let’s try to find the answer to this question on charts (charts courtesy of http://stockcharts.com).
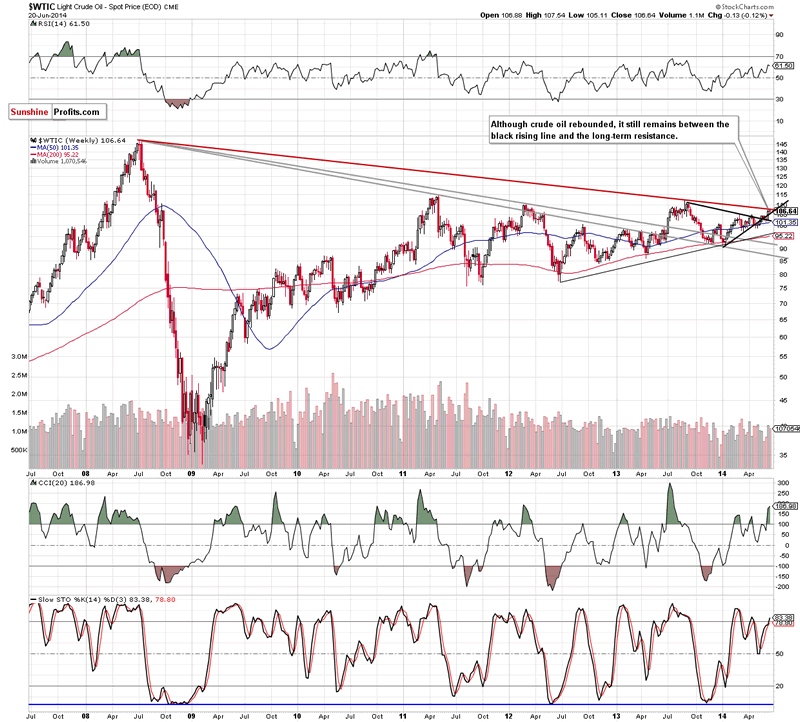
Looking at the weekly chart, we see that although crude oil rebounded and came back above the black support rising line, the commodity still remains below the long-term declining resistance line. Therefore, we think that as long as light crude is trading in this narrow range another sizable move to the upside or downside is likely to be seen.
What can we infer from the daily chart?
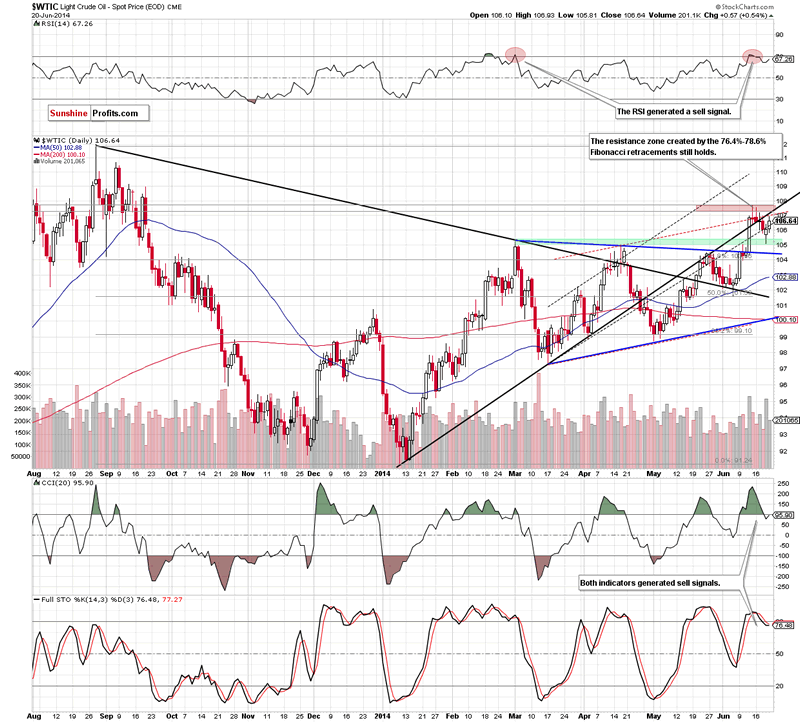
From this perspective, we see that light crude extended gains and climbed above the previously-broken black dashed support/resistance line. Although an invalidation of the breakdown is a bullish signal, we should keep in mind that despite Friday’s improvement, the commodity still remains below the medium-term black rising line and the strong resistance zone created by the 76.4% and 78.6% Fibonacci retracement levels. As a reminder, this resistance area successfully stopped further improvement in mid-June, triggering a recent decline. Therefore, we believe that if history repeats itself once again, we will see another pullback from here in the coming days. If this is the case, the initial downside target for oil bears will be the support zone created by the previous highs (marked with green). Please note that the current position of the indicators supports the bearish case as sell signals are still in play.
Summing up, although crude oil rebounded and invalidated the breakdown, we remain bearish as crude oil still remains below the medium-term black line and the strong resistance zone created by the Fibonacci retracement levels. As we mentioned earlier, if history repeats itself once again, we will see a pullback from here to at least around $105, where the nearest support zone is.
Very short-term outlook: bearish
Short-term outlook: mixed with bearish bias
MT outlook: mixed
LT outlook: mixed
Trading position (short-term; our opinion): Short. Stop-loss order at $109.20.
Thank you.
Nadia Simmons
Sunshine Profits‘ Contributing Author
Oil Investment Updates
Oil Trading Alerts
* * * * *
Disclaimer
All essays, research and information found above represent analyses and opinions of Nadia Simmons and Sunshine Profits' associates only. As such, it may prove wrong and be a subject to change without notice. Opinions and analyses were based on data available to authors of respective essays at the time of writing. Although the information provided above is based on careful research and sources that are believed to be accurate, Nadia Simmons and his associates do not guarantee the accuracy or thoroughness of the data or information reported. The opinions published above are neither an offer nor a recommendation to purchase or sell any securities. Nadia Simmons is not a Registered Securities Advisor. By reading Nadia Simmons’ reports you fully agree that he will not be held responsible or liable for any decisions you make regarding any information provided in these reports. Investing, trading and speculation in any financial markets may involve high risk of loss. Nadia Simmons, Sunshine Profits' employees and affiliates as well as members of their families may have a short or long position in any securities, including those mentioned in any of the reports or essays, and may make additional purchases and/or sales of those securities without notice.
© 2005-2022 http://www.MarketOracle.co.uk - The Market Oracle is a FREE Daily Financial Markets Analysis & Forecasting online publication.