


Which Way is Inflation Blowing? Watch Commodities
Commodities / Inflation Jul 16, 2014 - 04:28 PM GMTBy: Gary_Dorsch

 In an age when governments of every political leaning and ideological stripe distort economic data to promote their parties’ interests, it is hardly surprising that the nation’s inflation rate is reported in a manner that best suits their political needs. By the same token, in an age of near universal cynicism on the part of citizens towards their corrupt politicians, - it is entirely natural for official inflation data to be wildly at odds with the reality faced by consumers and businesses, and in turn, to be regarded with utter disbelief.
Since the days of the Clinton administration, the US-government has tinkered with the methodology of computing the inflation rate, and therefore, the CPI is no longer considered to be an objective gauge of the prices of a fixed basket of goods, that consumers normally buy. Instead, the US-government has a vested interest in understating the true rate of inflation, because it enables Washington to lower cost of living allowances for Social Security checks, helps the Fed to keep interest rates artificially low, weakens wage demands, buoys confidence in the US dollar, and artificially increases the “real” rate of US-economic output.
The tens of thousands of government apparatchiks who work for the Bureau of Labor Statistics, Bureau of Economic Analysis, US Treasury, Office of Management and Budget, Economics and Statistics Administration, and countless other agencies, - massage their spreadsheets day in and day out, and fudge the numbers. It’s hard not to notice that the inflation rate is reported with distortions caused by seasonal adjustments, hedonic deflators, chain-weighted substitutions, skewed sampling, delayed reporting, and with a twist of political bias. Yet perhaps the simplest advice on how to resolve contradictions between the costs that households face everyday, and the phony CPI, is to watch the dollars and cents flowing through the global commodity markets, and to map their longer term price trends. Who are you going to believe, the commodity price charts or skewed data from apparatchiks?
Commodities make-up 40% of CPI, According to the Bureau of Labor Statistics, in 2012, US-households spent 40% of their total expenditures on commodities, and the remaining 60% was spent on services. Thus, the commodities markets have become less of a leading indicator of future trends of inflation than in the past, when commodities made up 58% of expenditures in 1980 and 64% in 1970. Still, the alternative to relying on the commodities markets for clues on inflation, is to blindly adopt the Fed’s favorite gauge of inflation, the “personal-consumption-expenditures” price index, (the PCE), which strips out the cost of the basic essentials of life, and is conjured-up by apparatchiks. The PCE was reported to be +1.8% higher in May from a year earlier, or -0.3% less than the CPI.
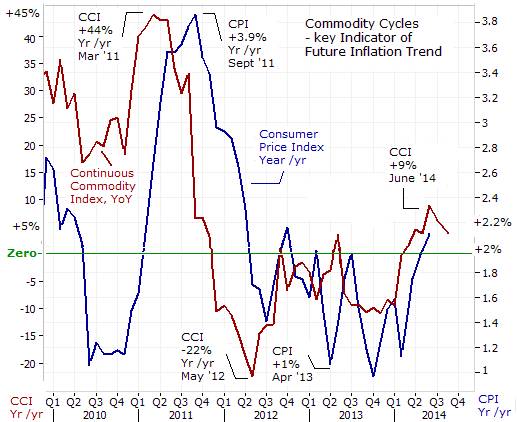
On June 17th, 2014, the US-government reported that consumer prices increased +0.4% in May - the biggest monthly increase in more than a year, saying the cost of food and gasoline showed big gains. Airline fares jumped +5.8% - their largest monthly increase in 15-years. The cost of clothing, prescription drugs and new cars all showed increases. Overall, the consumer price index was +2.1% higher compared with a year earlier. That left prices rising at slightly above the Fed’s so-called +2% inflation target, and traders questioned if the uptick would sound the alarm bells at the Yellen Fed.
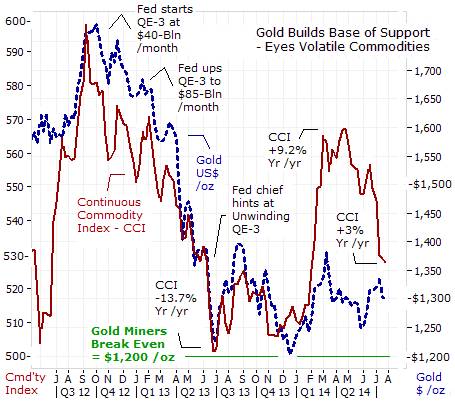
The increase in the consumer inflation rate was preceded by a sharp upturn in the market value of the Continuous Commodity Index (CCI), a basket of 17-equally weighted commodities – that started in January ‘14. Six months later, the CCI was trading +9% higher than a year earlier. For the first time in 2-½-years, the CCI has emerged from deflation territory (or negative year-over-year returns). However, commodity prices are notoriously volatile, and so, the outlook for inflation can often turn on a dime.
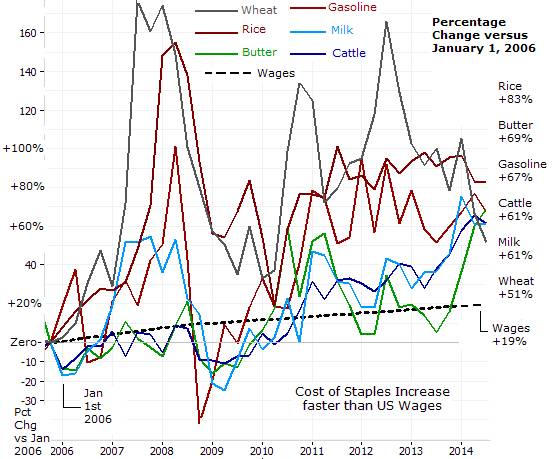
Commodity markets are notoriously volatile from month to month, and from year to year, quite often due to unforeseen acts of nature or military conflict. However, in order to filter out the “noise” of the markets, a simple approach is to take a much longer-term view of price trends. And for a wide array of commodities, their prices have trended significantly higher. For some of the basic staples of life, the market price of rough rice is up +83% higher, Butter is up +69%, and unleaded gasoline is up +67%, compared with 8-½-years ago. Milk and cattle prices are up +63%, and the cost of Wheat is up +61%. So when Americans are driving to the grocery store, they are feeling the pinch of accumulated rates of inflation.
But what about the wages of the US-worker, - have they kept pace with the increasing cost of living? According to the Labor Dept apparatchiks, the average wage is up +19% compared with 8-½-years ago, for an increase of +2.2% per year, on average. However, for many Americans, their incomes are actually declining and that could put a squeeze on discretionary spending. For example, in the month of June ‘14, the BLS reported that the number of higher paying, full-time jobs plunged by -523,000 to 118.2-million while lesser paying, part-time jobs increased +799,000 to over 28-million. That suggests that many US-workers’ are being forced into part-time work, and their income is decreasing. Thus, the hallowing out of the US-middle class and the impoverishment of the lower income groups is worsening.
As such, the Fed is already talking about moving the goal posts again, from targeting inflation to targeting wage increases. “Signs of labor-market slack include slow wage growth and low labor-force participation,” Fed chief Yellen said on July 15th. Earlier, on July 11th, Chicago Fed chief Charles Evans, said on Bloomberg TV that it would not be a “catastrophe” to allow the inflation rate to overshoot the Fed’s +2% target. “Even a +2.4% inflation rate, I think that could work out,” he said. So the message is; the Fed would be tolerant of above target inflation, since lower paying part-time wages are supposed to keep inflationary pressures in check. For the Fed, with the passage of time, many of its sins of the past, in the form of a higher cost of living, are seemingly washed away into obscurity.
Fed chief says Uptick in Inflation is “Noisy” When asked about the recent uptick in the consumer inflation rate to +2.1% in the month of May, Fed chief Janet Yellen downplayed the threat saying; “So I think recent readings on, for example, the CPI index, have been a bit on the high side, but I think it’s - the data we are seeing is noisy. It’s important to remember that, broadly speaking, inflation is evolving in line with the “Committee’s” (ie; Politburo’s) expectations. The Fed (ie; politically appointed Politburo) has expected a gradual return in inflation towards its +2% objective, and I think the recent evidence we have seen ... suggests that we are moving back gradually over time to our +2% objective, and I see things roughly in line with where we expected inflation to be,” she said.
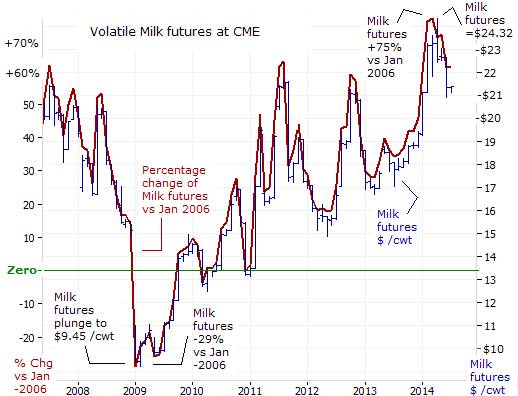
However, the reality for the 48-million Americans that are receiving food stamps is their monthly stipend is buying a lot less butter, cheddar cheese, chocolate, and milk, these days. At the Chicago Mercantile Exchange, the nearby futures contract for Milk futures is +23% higher, compared with a year ago, and up +75% compared with 8 ½ years ago. However, in the Fed’s view, the soaring cost of dairy products is only transitory. After all, according to the Law of Gravity, what goes up must eventually come down, right?
From Asia to South America, the demand for US-dairy products processed foods containing milk, such as cheddar cheese, is up +19% compared with a year ago, according to the US Dairy Export Council. Exports of cheese jumped +46% in the past year, led by a +38% increase to Mexico, the biggest buyer of US-dairy products, and a doubling of sales to China. Exports of dry milk now account for 16% of all dairy sales, compared with 5% a decade ago. As such, Dairy farmers’ revenue soared +35% last year to $584-million.
So far this year, rising dairy and meat costs are the biggest sources of inflation. Safeway, the second-largest US-supermarket operator with a network of more than 2,400-stores and 250,000 employees, said on April 23rd, that it plans to pass along the higher costs for meat, produce and other staples on to shoppers at its US grocery stores in the second quarter. Hershey <HSY.N> the # 1 candy maker in the United States, said it would increase prices of its instant consumable, multi-pack, packaged candy and grocery lines by about +8% to tackle rising commodity costs, with Cocoa futures trading at a 3-year high.
However, higher prices for dairy products have widened profits margins for farmers, and in turn, they are already decreasing their dairy cow culling rates, in order to boost the supply of milk. New Zealand, the world’s top dairy exporter, is expanding its output of Milk to an all-time high, in order to meet growing demand in China, and is setting the stage for a surplus of Milk, in the months ahead. Increased output in New Zealand has already rattled the Milk futures market on the Chicago Mercantile Exchange, - the nearby contract has slumped -12% from a record high of $24.32 /hundred pounds, in April. Class III milk, used to make cheese, closed at $21.42 / per hundred pounds today. The price of nearby Cheddar Cheese futures have dropped from an all-time of $2.35 /pound to $2.04 today.
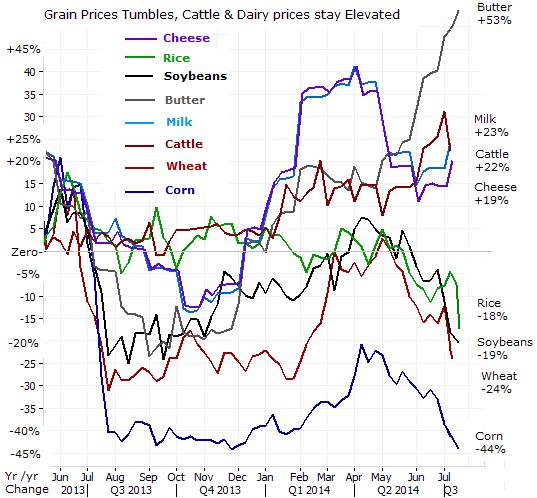
Rout in Chicago Grains markets, - In a year when American dairy farmers are enjoying windfall profits, other US-farmers can expect to see lower earnings than in 2013. US- farmers will suffer a -21% drop in net-cash income, on average, due to sharply lower prices for their biggest cash crops, - corn, wheat and soybeans. At the same time, dairy farmers will earn +28% more or roughly $334,100 on average, this year, the USDA predicts.
Two years ago, on the Chicago Board of Trade, Corn futures sold for as high as $8.43 /bushel shortly after the US Dept of Agriculture gave its assessment of the effects of the historic drought plaguing the Farm Belt. The USDA lowered its estimate of the US’s corn production at 10.8-billion bushels, or -13% below 2011, and the lowest since 2006. However, US-farmers figured that drought like conditions would last for a long time, and many decided to profit from record high prices by boosting output. In turn, the collective actions of the farmers created a huge glut of supply in today’s grains markets.
Two years removed from a devastating drought that sent US-grain prices soaring, - the price of Corn has dropped in half, tumbling to $3.75 per bushel today, and its lowest level in four years. It’s estimated that the average cost of production is around $3.50 for a bushel of corn, which could act as a floor for corn prices. Soybean prices have plunged from a record high of $18 /bushel two years ago, to $11.80 /bushel today, its longest slump in 41-years. The farther dated Nov ’14 contract is priced below $11 /bushel. The USDA says US-farmers will harvest 3.8-billion bushels of soybeans this year, compared with last year’s crop of 3.3-billion. Amid a bumper crop that is expected to boost global stockpiles to the highest level in 14-years, corn futures are -44%, wheat is -24% lower, soybeans -20% lower, and rice is -18% lower.
“Let them eat Rice,” Of more than 50,000 edible plant species in the world, only a few hundred contribute significantly to food supplies. Just 15 crop plants provide 90% of the world’s food energy intake, with three rice, maize (corn) and wheat - making up two-thirds of this. Whether birthed from Indian soil, or in China or Japan, - Rice is a staple food for nearly one-half of the world’s population. Today, rice and wheat share equal importance as leading food sources for humankind. Rice provides fully 60% of the food intake in Southeast Asia and about 35% in East Asia and South Asia. The highest level of per capita rice consumption is in Bangladesh, Cambodia, Indonesia, Laos, Thailand, and Vietnam.
Yet only 5% of the global production of Rice is available for export. Thus, Rice commands a higher price than wheat on the international market, because a higher percentage of the wheat crop (16%) is available for export. That leaves small rice-producing countries such as Thailand, Vietnam, and the US as the top exporters of Rice. On the basis of yield, rice crops produce more food energy and protein supply per hectare than wheat and maize. Hence, rice can support more people per unit of land than the two other staples.
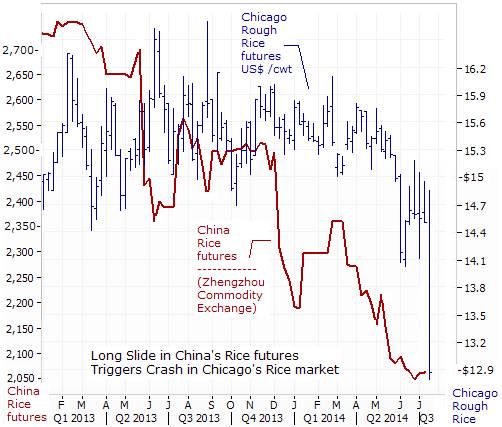
With its invaluable status as a staple food source in two of the most populous nations on earth and the domination of its export share by relatively small producers, rough rice futures have attracted both hedgers and speculators. In July ’12, China, the world’s top rice producer and consumer, launched the early Indica rice futures contract on the Zhengzhou Commodity Exchange, -a world bellwether. Since the inception of the contract, early Indica rice futures have been gripped by a grizzly Bear market, - losing -28% to 2,050 yuan /ton this week.
Yet Rough Rice futures traded on the CBoT were remarkably stable over the past few years, - gyrating within a narrow range between $14 and $16 /hundred pounds (cwt). However, starting in late May ’14, Chicago rice began to tumble, plunging -10% over a two week period, to as low as $14 /cwt, before crashing to $12.85 /cwt this week. This is certainly good news for citizens residing in the Emerging countries, where households spend as much as 30% of their income on purchases of food.
Industrial Commodities Still Sagging, - A pickup in the US’s official consumer inflation rate towards the central bank’s +2% objective has some Fed officials warning about the danger of risking faster inflation in the future by waiting too long to start raising interest rates. The Fed hawks argue that the central bank must move to tighten its monetary policy sooner, rather than later. The way Philly Fed chief Charles Plosser sees it, the Fed is sitting on a ticking time bomb. “One thing I worry about is that if we are late, in this environment, with $2.7-trillion of excess reserves, the consequences might be more dramatic than in previous times. If lending begins to surge and those reserves start to pour out of the banking system, that’s going to put pressure on inflation,” Plosser warned.
However, Janet Yellen, the money printer in chief, is not swayed by the hawkish view. “Inflation has moved up in recent months” she acknowledged, “but decisions about the path of the federal funds rate remain dependent on our assessment of incoming information and the implications for the economic outlook,” Yellen told Congress on July 15th. “The Fed does need to be quite cautious with respect to monetary policy. We have seen false dawns in the past,” she said. “With wages growing slowly and raw material prices generally flat or moving downward, firms are not facing much in the way of cost pressures that they might otherwise try to pass on,” the Fed said in a report accompanying Yellen’s testimony.
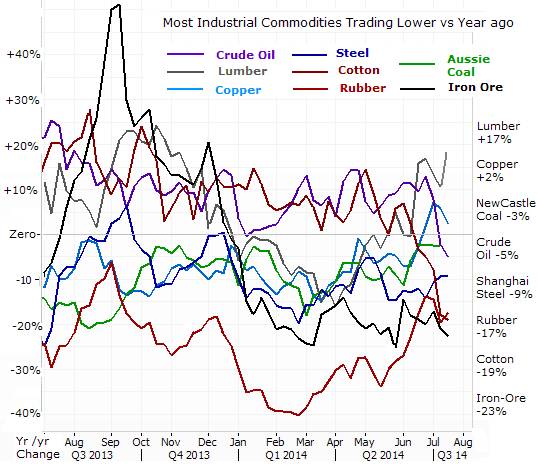
It’s true that the most economically sensitive commodities, traded in Shanghai, such as steel, iron-ore, and rubber, are trading at sharply lower levels than compared with a year ago, and thus, helping to keep a lid on factory gate inflation. Free-falling cotton futures hit fresh two-year-plus lows to close around 68- US-cents, amid expectations for a buildup in US-stockpiles and growing world inventories outside China. In June, the World Bank cut its projection for global growth to +2.8% this year, from its earlier estimate of +3.2%. That’s half the growth rate of the pre-financial crisis economy. The World Bank also downgraded its outlook for the US-economy to +2.1% for 2014, down from +2.8% earlier.
Commodities such as copper, rubber and iron-ore have been commonly used in China for collateral, where traders or investors borrow against the commodity with the aim of investing yuan in real estate or sub-prime loans in the shadow banking sector. Some estimates put the portion of inventories of iron-ore that is used as collateral at 40%. Now that Beijing' is cracking down on shadow lending and weakened the yuan – a deliberate move by authorities – Beijing is trying to push these deals under water. As such, some of these commodities held in storage can find their way back onto the market and weigh on prices.
China produces as much steel as the rest of the world combined and it’s most actively traded steel futures contract - Shanghai rebar - dropped to a record low of 2,800-yuan /ton on June 30th. That’s down nearly -50% from a record high of 5,450-yuan hit 3-years ago. Chinese steelmakers suffer from chronic lack of profitability and overcapacity of close to 200-million tons. Despite weak end demand and Beijing's attempts at consolidation and its crackdown on polluting industries, steel production continues apace because regional authorities are fearful of closing down plants that provide considerable regional revenue and employment.
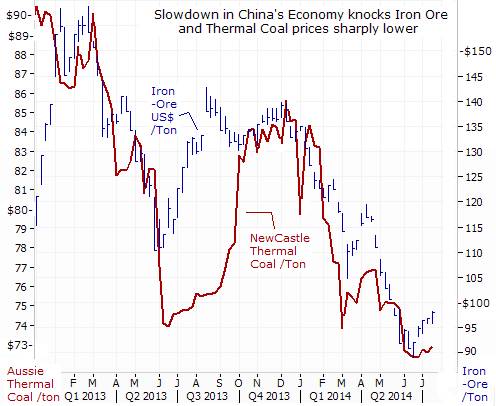
In Shanghai, the spot market for iron ore briefly fell below $90 /ton on June 16th, for the first time since September 2012. If sustained below $90 /ton, about one fifth of China’s iron ore miners would be forced to shut down around 80-million tons of output per year. In contrast, Rio Tinto breaks even at $43 /ton, and BHP stays in the black at $45. Brazil’s Vale’s break even is $75 /ton, due to the greater distance to ship ore from Brazil to China. Iron ore has since rebounded to $97 /ton, but is still trading -23% lower than a year ago.
The cartel that controls the majority of the world’s rubber production, Thailand, Indonesia and Malaysia has urged its exporters not to sell the commodity, below $1.90 or 62.70 Thai baht / kg as the average output cost for growers in Southeast Asia is about 60-baht. The price of natural rubber is -16% less than a year ago, and at 13,750-yuan /ton in Shanghai, has lost about two thirds of its value. Stockpiles of rubber at the Shanghai Futures Exchange are at the highest in 10-years, and a global surplus of 241,000 tons is expected in 2014.
Prices for thermal coal are expected to remain weak, with oversupply continuing to plague the market until producers curb output further. Coal prices in Europe and Asia have lost more than half their value since spring 2011, with European physical coal for September delivery was trading at $72.65 /ton, near five-year lows. New-Castle coal prices mined in Australia have also fallen below $70 /ton, bumping along five-year lows, as record output in Q’1 coincided with slowing import needs from China, the world’s biggest coal buyer.
Gold Builds a base, eyes Volatile Commodities, History shows that rapid growth of the money supply usually fuels higher rates of inflation. Yet while the Fed increased the size of the MZM Money supply +$700-billion in 2013, and +$350-billion in the first half of 2014, what has surprised traders is the lethargic behavior of the US’s rate of inflation. The CPI increased +1.5%, on average, in 2013, and bumped up to +2.1% in May ’14. However, given the -6% slide in the Continuous Commodity Index since the start of July, led by a drop of 20-cents in the price of unleaded gasoline on the Nymex, it’s a good bet that the consumer price index will start to edge lower again, with a lag time of 2-3-months.
Former Fed deputy Alan Blinder explained why the Fed’s QE-scheme didn’t spark an upward spiral in inflation. “The monies the Fed pumped into the banking system didn’t circulate in the US-economy. Instead, it all got bottled up in the banks, and essentially, none of it got lent out,” he explained. Because the Fed began to pay 0.25% interest on excess reserves, the banks agreed to park the QE-monies at the Fed itself, instead of lending and creating deposits and increasing the money supply. Therefore, QE didn’t contribute to inflation. And if banks aren't lending, there’s no boost to the economy. However, there is reason to believe that the $3.5-trillion of QE-injections were funneled into the US-bond and stock markets.
The meltdown in the yellow metal in 2013 left many Gold bugs licking their wounds. However, in hindsight, - the collapse in the Continuous Commodity Index (CCI), in the first half of 2013, was probably the biggest contributing factor behind Gold’s slide to the $1,200 level. And it’s the narrative about low inflation and /or deflation, and weak Gold prices that enables the endless printing of money by central banks. Bubbles in the European and US bond and stock markets can be sustained in the stratosphere, as long as inflation is said to be running near-zero. In fact, the Bank of Japan, the ECB and the Fed all say they must print money to counter the threat of deflation. As for the price of Gold, the average break-even point for Gold miners worldwide is estimated to be around $1,200 /oz, and it’s this figure, that was the “rock bottom” price for the yellow metal in 2013. Gold Bugs have been building a big base of support for the past 12-months, but a sustained rally to $1,400 /oz and beyond, might require the revival of the “Commodity Super Cycle.”
This article is just the Tip of the Iceberg of what’s available in the Global Money Trends newsletter. Global Money Trends filters important news and information into (1) bullet-point, easy to understand reports, (2) featuring “Inter-Market Technical Analysis,” with lots of charts displaying the dynamic inter-relationships between foreign currencies, commodities, interest rates, and the stock markets from a dozen key countries around the world, (3) charts of key economic statistics of foreign countries that move markets.
Subscribers can also listen to bi-weekly Audio Broadcasts, posted Monday and Wednesday evenings, with the latest news and analysis on global markets. To order a subscription to Global Money Trends, click on the hyperlink below,
http://www.sirchartsalot.com/newsletters.php
or call 561-391- 8008, to order, Sunday thru Thursday, 9-am to 9-pm EST, and on Friday 9-am to 5-pm.
This article may be re-printed on other internet sites for public viewing, with links to:
http://www.sirchartsalot.com/newsletters.php
Copyright © 2005-2014 SirChartsAlot, Inc. All rights reserved.
Disclaimer: SirChartsAlot.com's analysis and insights are based upon data gathered by it from various sources believed to be reliable, complete and accurate. However, no guarantee is made by SirChartsAlot.com as to the reliability, completeness and accuracy of the data so analyzed. SirChartsAlot.com is in the business of gathering information, analyzing it and disseminating the analysis for informational and educational purposes only. SirChartsAlot.com attempts to analyze trends, not make recommendations. All statements and expressions are the opinion of SirChartsAlot.com and are not meant to be investment advice or solicitation or recommendation to establish market positions. Our opinions are subject to change without notice. SirChartsAlot.com strongly advises readers to conduct thorough research relevant to decisions and verify facts from various independent sources.
Gary Dorsch Archive |
© 2005-2022 http://www.MarketOracle.co.uk - The Market Oracle is a FREE Daily Financial Markets Analysis & Forecasting online publication.