


AAPL Apple Stock About To Get sMACked
Companies / Apple Aug 29, 2014 - 10:43 AM GMTBy: Austin_Galt

 iPads and iPhones. Fad or fashion? I’m not sure. What I am sure about is the company that invented these devices has hit the jackpot! With that in mind, I thought I would investigate the charts of this company, Apple Inc.
Let’s first take a look at the big picture using the yearly chart.
YEARLY CHART
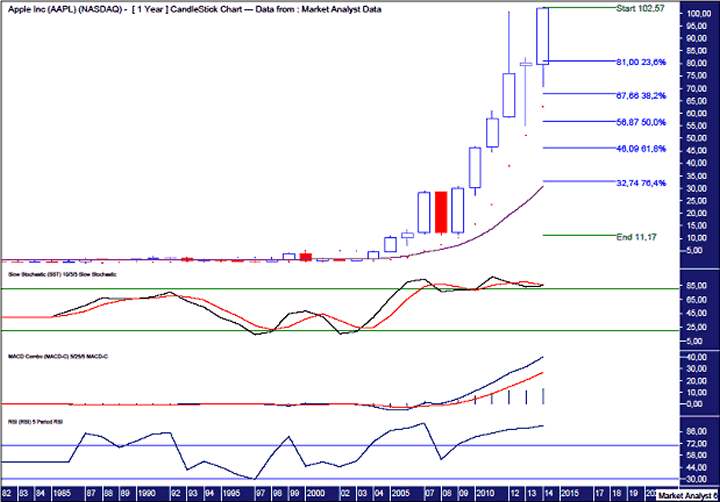
This chart begins in 1982 and price pretty much just flat-lined for the next 20 years. It had a little run up in the dot com bubble but it wasn’t until 2004 that things started heating up. This was when the company started putting an “i” in front of its products name, beginning with the iPod. Such a simple piece of brilliance!
Since then, price has absolutely exploded hitting all time highs this week above $102. Forget about a worthy 10 bagger. This has been more like a 60 bagger! Magical stuff.
So what is likely to happen to the share price going forward?
Well, as long as they keep putting an “I” in front of each new product’s name, it should keep going up if the past is any guide.
But let’s take the emotion out of it and look at the cold hard facts.
I have added a Stochastic indicator which is at overbought levels. While that could continue for some time yet, caution should be heeded. A bearish crossover occurred last year and the red line is still above the black line so bias has to be given to lower prices.
I have added a Moving Average Convergence Divergence (MACD) indicator which shows a nice trend up but the averages do appear to be diverging quite a bit. When the averages get that far apart it usually means some realignment can be expected a la regression to the mean.
I have added a Relative Strength Indicator (RSI) and what is interesting here is that if a top forms around here, a bearish divergence will be made. This top will be weaker than the 2007 top. That could be expected to lead to a decent correction. However, a third bearish divergence is also possible in the years to come so perhaps after the correction, new highs will be seen.
I have also added a Parabolic Stop and Reverse (PSAR) indicator which pertains to the dots on the chart. Price is still in a bullish position with the dots underneath price. However, the dots are getting steeper and steeper which is evidence that price has gone parabolic. Given price has increased over 60 fold, that isn’t really news. But is does suggest that a healthy correction has to be close.
If price were indeed to top out around here, what levels could price be expected to pull back to?
I have added Fibonacci retracement levels of the upleg from the 2009 low to recent high. Keep in mind, the top may not be in but I only expect marginally higher which won’t affect this analysis.
I favour a decent pull back to the 61.8% or 76.4% levels. These stand at $46.09 and $32.74 respectively.
Old tops often provide support in the future and the 2007 top at $28.99 may be helpful there.
Also, I have added a 14 period moving average denoted by the purple line. Price often corrects to its moving averages so this is another potential target. It is currently just under $31 and rising.
Let’s move on to the monthly chart.
MONTHLY CHART
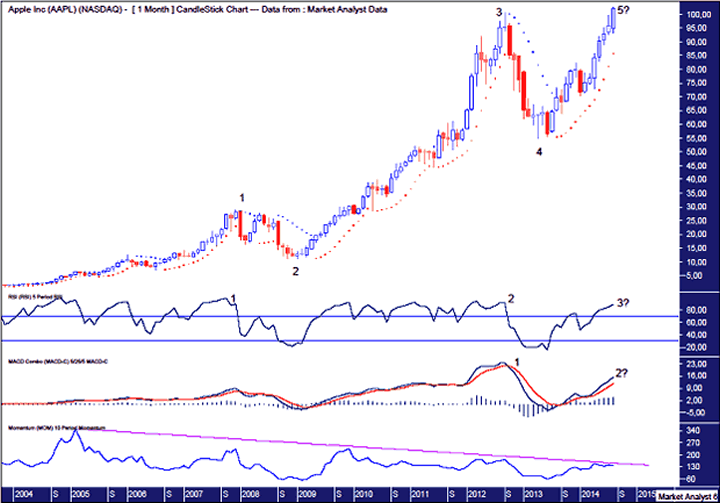
I have added Elliott Wave annotations in order to give some structure to the picture. I only ever apply my bastardised version of EW so experts need not get their knickers in a knot if some miniscule rule is broken. The end of the first wave was the 2007 high and is denoted by the number 1. Then, after a wave 2 correction, a big impulsive wave 3 took place finishing in 2012 and is denoted by the number 3. Since then price has retreated and has just recently nudged to new all time highs. I am viewing this as the final wave 5.
Once again, I have added a PSAR indicator. And just as it showed price going parabolic in the yearly chart, it also shows it here with the move up from its most recent low. Surely, something has to give here soon.
I have added a RSI which shows a high now would be accompanied by a third bearish divergence. The 2012 high was weaker than the 2007 high and a high now will be weaker again.
I have added a MACD indicator which also shows a bearish divergence in the making.
And finally, I have added a Momentum indicator which shows momentum declining ever since it’s top in 2005. Price really appears struggling to reach the finish line!
So, both the yearly and month analysis suggest a top and then significant correction are just around the corner. Let’s now see what the weekly chart is showing.
WEEKLY CHART
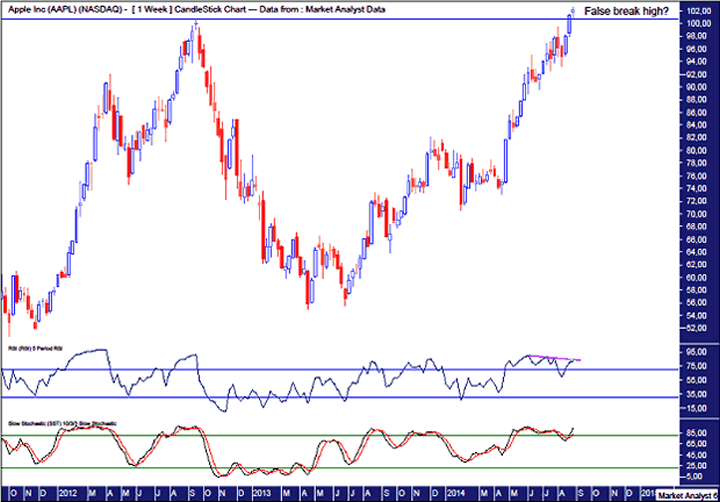
I have added a RSI which shows this top forming is about to set up a triple bearish divergence. Price has been losing strength ever since the June 2014 high.
I have also added a Stochastic indicator. It looks like it is having one last hurrah in overbought territory.
One of my favourite topping (and bottoming) patterns is a marginal false break setup. In this case, price looks to be making a marginal break of the 2012 top which is denoted by the horizontal line. A move back below this line will confirm a false break top.
While Apple had a cracker of a run up, the greater the rise, the greater the potential smackdown. Something to ponder at these heady heights.
Disclosure – I have no financial interest in AAPL.
Bio
I have studied charts for over 20 years and currently am a private trader. Several years ago I worked as a licensed advisor with a well known Australian stock broker. While there was an abundance of fundamental analysts there seemed to be a dearth of technical analysts, at least ones that had a reasonable idea of things. So my aim here is to provide my view of technical analysis that is both intriguing and misunderstood by many. I like to refer to it as the black magic of stock market analysis.
Please register your interest in my website coming soon. Any questions or suggestions, please contact austingalt@hotmail.com
© 2014 Copyright Austin Galt - All Rights Reserved
Disclaimer: The above is a matter of opinion provided for general information purposes only and is not intended as investment advice. Information and analysis above are derived from sources and utilising methods believed to be reliable, but we cannot accept responsibility for any losses you may incur as a result of this analysis.
© 2005-2022 http://www.MarketOracle.co.uk - The Market Oracle is a FREE Daily Financial Markets Analysis & Forecasting online publication.