


Gold and Silver Price To Rally Or Not To Rally
Commodities / Gold and Silver 2014 Oct 13, 2014 - 07:12 AM GMTBy: Austin_Galt

 Both gold and silver rallied nicely off their lows the past week. So, is this the start of something bigger or just another blip in a doom and gloomy bear market? Let's have a look at the charts to find out. We'll begin with gold.
Gold Daily Chart
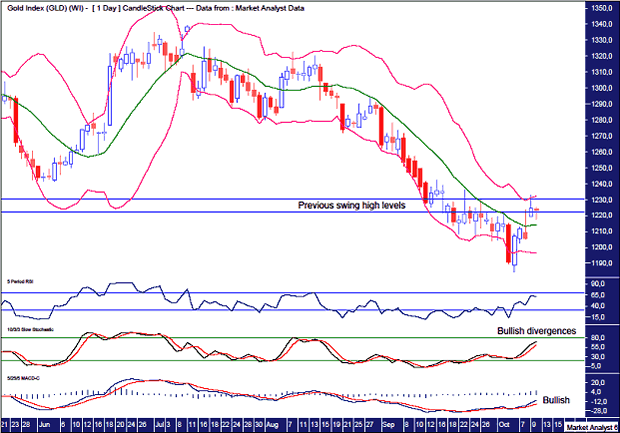
The move off the recent low looks impulsive with a big bullish candle leading the charge.
The Bollinger Bands show price in a washout move into low below the lower band before a sharp reversal higher which subsequently hit the upper band. From here it is possible to continue on up clinging to the upper band in super bullish style. However, keeping in mind that this move up is against the trend, I favour price action to be a bit choppy and hence trade back down to the lower band and consolidate the recent move up.
This move up busted two previous minor swing highs which is a good sign for the bulls. So we have a higher high and now all that is needed is a higher low and it will be up, up and away. Well, as high as a bear rally can fly.
The Relative Strength Indicator (RSI) and Stochastic indicator are both trending up and showing bullish divergences while the Moving Average Convergence Divergence (MACD) indicator is also looking quite bullish with the blue line above the red line which also comes on top of some nice bullish divergences.
Gold Weekly Chart
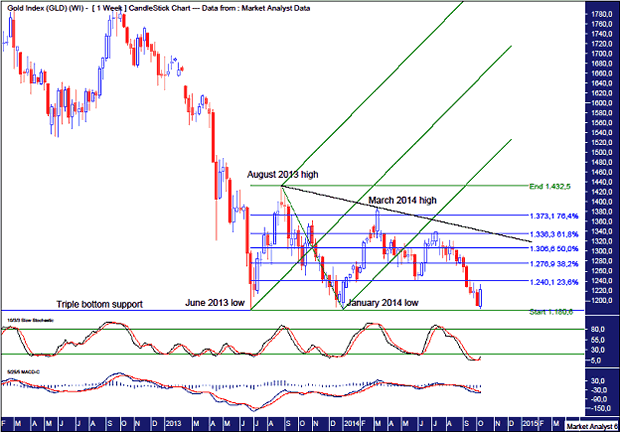
The weekly Stochastic indicator shows a recent bullish crossover while the MACD indicator looks to be threatening one but still has a bearish bias. So the jury is still out on any continuation of the rally.
The recent low around US$1184 was right at triple bottom support so there is a strong foundation here for a big rally to commence.
I have added an Andrew's Pitchfork using the June 2013 low for the base and the August 2013 high and January 2014 low for the upper and lower channels. We can see the recent move up failed to get back up into the lower channel. This shows gold to be in a weak position in line with the overall bear trend.
I have added Fibonacci retracement levels and I'm expecting this rally to eventually get up to the 76.4% level at US$1373 and challenge the March 2014 high at US$1387. I expect the challenge to fail and a move back down to bust the triple bottom which would lead to a capitulation type move into final low.
I have drawn a black trend line across the tops of August 2013 and March 2014 which should be cracked in a fake out move to bring out the bulls prematurely.
While I believe the rally to be underway, I favour a pullback first before the rally really kicks into gear. I actually think price can retreat all the way back to around last week's open price of US$1188. Let's see.
Silver Daily Chart
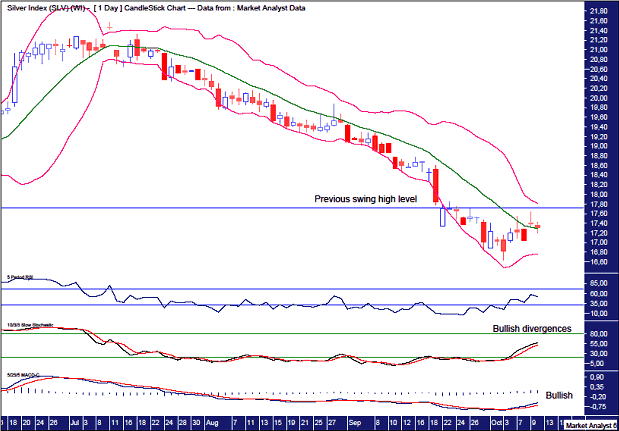
The RSI, Stochastic and MACD indicators are all basically mirroring that of gold - bullish divergences in the RSI and Stochastic while the MACD is looking bullish.
Even so, silver looks to be in a much weaker position than gold. Why?
Price has failed to take out a previous swing high on this move up. Also, price does not seem to be exhibiting the same impulsiveness that gold is showing.
The Bollinger Bands show price not being able to get up to the upper band and only seems to be milling around the middle band. It looks like one last low is in order which breaches the lower band just as the recent gold low breached it' s lower Bollinger Band.
Given this, I favour one last move back to a new low before the silver rally can commence in earnest.
Silver Weekly Chart
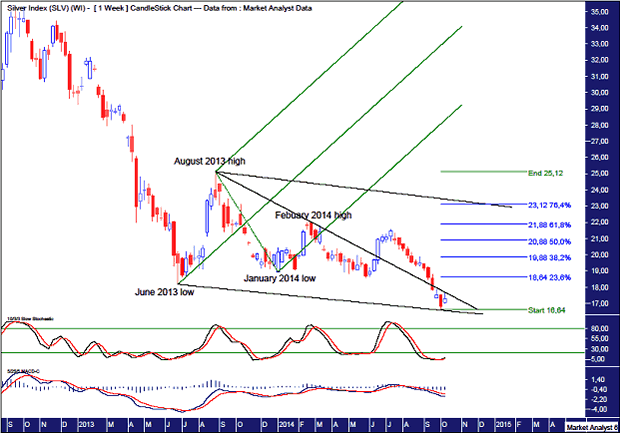
The Stochastic indicator shows a recent bullish crossover while the MACD indicator looks to be threatening one but still with a bearish bias a la gold.
As with gold, I have added an Andrew's Pitchfork which demonstrates how much weaker silver is compared to gold. I have used the same low and high points to construct the pitchfork and price never looked likely to get back up into the lower channel.
Also, price is already finding resistance from the trend line drawn across the August 2013 and February 2014 highs. Perhaps price will crack this resistance on its next attempt.
I have added Fibonacci retracement levels from the move down from August 2013 high to recent low. While I suspect the low is not yet in, I expect only marginally lower which won't have any significant impact on this analysis. As with gold, I'm looking for a rally up to the 76.4% level which currently stands around US$23.
I have drawn two black parallel lines which form a downtrend channel which I suspect is about to form. Perhaps I'm being a bit presumptive here. Let's call it forward thinking! The upper trend line looks close to intersecting the 76.4% Fibonacci level and it is here where I expect the silver rally to eventually terminate.
In concluding, I am expecting a big rally in both gold and silver. It is my opinion that the gold low is in already but is about to be tested while silver needs one last marginal low before it's rally can begin.
By Austin Galt
Austin Galt is The Voodoo Analyst. I have studied charts for over 20 years and am currently a private trader. Several years ago I worked as a licensed advisor with a well known Australian stock broker. While there was an abundance of fundamental analysts, there seemed to be a dearth of technical analysts. My aim here is to provide my view of technical analysis that is both intriguing and misunderstood by many. I like to refer to it as the black magic of stock market analysis.
© 2014 Copyright The Voodoo Analyst - All Rights Reserved
Disclaimer: The above is a matter of opinion provided for general information purposes only and is not intended as investment advice. Information and analysis above are derived from sources and utilising methods believed to be reliable, but we cannot accept responsibility for any losses you may incur as a result of this analysis. Individuals should consult with their personal financial advisors.
© 2005-2022 http://www.MarketOracle.co.uk - The Market Oracle is a FREE Daily Financial Markets Analysis & Forecasting online publication.