


New Year Updates in Gold and SP500 Stocks Index
Stock-Markets / Financial Markets 2015 Jan 05, 2015 - 04:56 PM GMTBy: David_Banister

Our long term subscribers have been following the Gold and SP 500 markets with us for years, and for sure last year was full of volatility in both. Right now we are continuing to stay on the sidelines in Gold until we can see a confirmed close over $1232 per ounce (US Dollars). We like to keep it simple and avoid a lot of the noise that the charts on a daily basis can bring, as well as day to day and week to week volatility.
The reality is that Gold has been in a Bear Cycle since the top in 2011 and over the past year or so has been attempting to establish a base pattern from which to bottom out and emerge back into a Bull cycle. However, the technical evidence does not yet support the Bull case and in fact suggests there is still potential for a final drop to the $1,050 per ounce area before a final washout low takes hold in 2015.
With that said, we are not biased in either direction and prefer to let the price action dictate our views and not our personal biases. We think a close over $1232 would represent a bullish change in direction as it represents the 30 week moving average line on weekly charts. We like to use this big picture charting for both the SP 500 and Gold because frankly its simple and it works. Yes, we can drill down on Elliott Wave patterns with the best of them and we do so as appropriate, but for the purpose of the general investing audience lets avoid that boredom and short term labeling issues and just focus on the big picture.
Over $1232 we start to get interested, under that we are out of the pool on the sidelines:
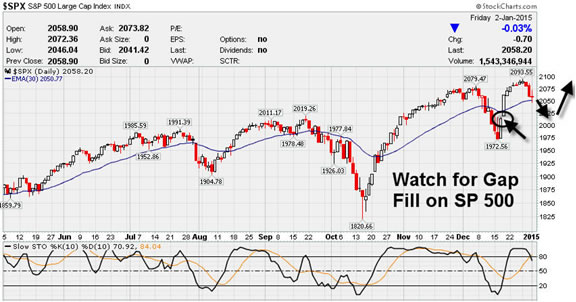
Now let’ts take a quick look at the SP 500 index. We have been calling this Primary wave 5 of the Bull cycle from March 2009. Others may certainly disagree but our view is for a low end target of 2181 and a high end target of 2525 for the SP 500 before Primary wave 5 ends and we start another bear cycle. We are certainly willing to adjust our views based on action but those are our current intermediate to longer term forecast points for the SP 500. Shorter term, keep an eye on that “Gap Fill” area on the daily SP 500 charts around 2012-2015 as likely to fill as early 2015 trading gets underway. We caution our stock trading and market forecast subscribers that early January volatility is notorious and caution is warranted in the first few weeks until we see where the rotations are taking place , tax selling ends, and other changes are completed by portfolio managers. Then of course earnings start coming out, so January as a rule is tough for most investors and traders.
If you would like to join us we offer regular forecasts with stunning accuracy using a combination of Elliott Wave Theory and other technical indicators sprinkled in to keep us in check. Check us out at www.markettrendforecast.com for a discount offer today. Our stock trading service has smashed the SP 500 index with swing positions and some long term positions as well. That is at www.activetradingpartners.com
Dave Banister
CIO-Founder
Active Trading Partners, LLC
www.ActiveTradingPartners.com
TheMarketTrendForecast.com
Dave Banister is the Chief Investment Strategist and commentator for ActiveTradingPartners.com. David has written numerous market forecast articles on various sites (SafeHaven.Com, 321Gold.com, Gold-Eagle.com, TheStreet.Com etc. ) that have proven to be extremely accurate at major junctures.
© 2013 Copyright Dave Banister- All Rights Reserved
Disclaimer: The above is a matter of opinion provided for general information purposes only and is not intended as investment advice. Information and analysis above are derived from sources and utilising methods believed to be reliable, but we cannot accept responsibility for any losses you may incur as a result of this analysis. Individuals should consult with their personal financial advisor.
© 2005-2022 http://www.MarketOracle.co.uk - The Market Oracle is a FREE Daily Financial Markets Analysis & Forecasting online publication.