The Final Phase Of The U.S. Treasury Bond Market Bubble
Interest-Rates / US Bonds Jun 20, 2015 - 03:11 PM GMTBy: Austin_Galt
 There has been quite a bit of chatter in recent times about the bond bubble bursting. So, have we seen the final high in bond prices or final low in interest rates? No, I don’t believe so but we are indeed approaching the final phase of this bond bubble.
Let’s try to nail down the end of this bull market in bond prices and bear market in bond yields or interest rates by analysing in detail the charts of the 30yr US T-Bond prices and yields. We’ll begin with the big picture yearly chart of bond prices.
30YR US T-BONDS YEARLY CHART
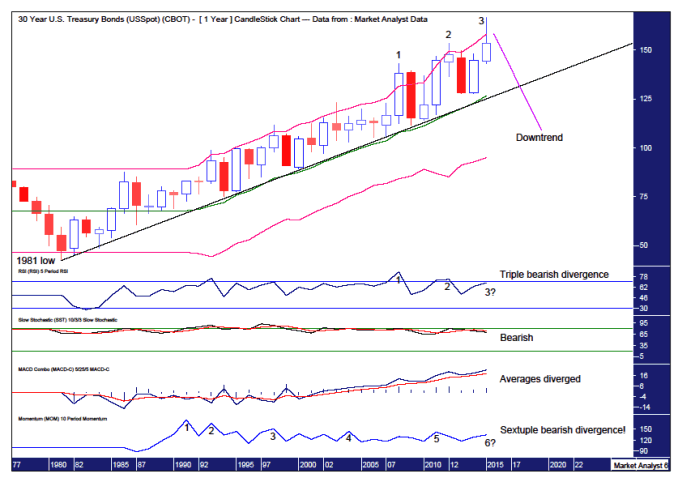
We can see the massive bull trend that has been in force since the 1981 low at 42.34 with price hitting an all time high recently at 166.84.
I have drawn an uptrend line which price has never seriously threatening in 34 years. Fabulous stuff! And still there is no sign of a breakdown.
However, there are signs that this massive bull market is nearing its end. What are they?
They say things happen in three’s while the old New York hip hop outfit, De La Soul, said 3 was the magic number. This applies to the market and it looks like, what I term, a “three strikes and you’re out” top formation is in play denoted by the numbers 1, 2 and 3. The third and likely final strike high is now in place or will be shortly.
Also, we can see this market bull market moved up steadily until price spiked up into the first strike high. This is when things started to get a bit more volatile while the most recent rise looks parabolic in nature which is often found at the end of bull markets.
The Bollinger Bands show the recent high traded well above the upper band which is consistent with solid tops and this is the yearly chart no less!
The lower indicators are also giving some big clues that time is just about up for this epic bull market. Let’s run through them.
The RSI shows a triple bearish divergence setting up with this recent price high. This often leads to a significant decline and that is my expectation here.
The Stochastic indicator already appears to be trending down with a bearish bias.
The MACD indicator shows the averages have diverged and its uptrend is looking long in the tooth.
The Momentum indicator looks set to throw up its sixth bearish divergence at this recent price high. Multiple bearish divergences in this indicator signifies the trend is running out of puff. This sextuple bearish divergence means this bull has a serious lactic acid problem as it staggers to the finish line!
The fact that there are so many bearish indications on this big picture yearly chart spells massive trouble. Let’s be clear about this. The coming drop in bond prices will send shockwaves throughout the world.
Let’s now move on to the monthly chart.
30YR US T-BONDS MONTHLY CHART
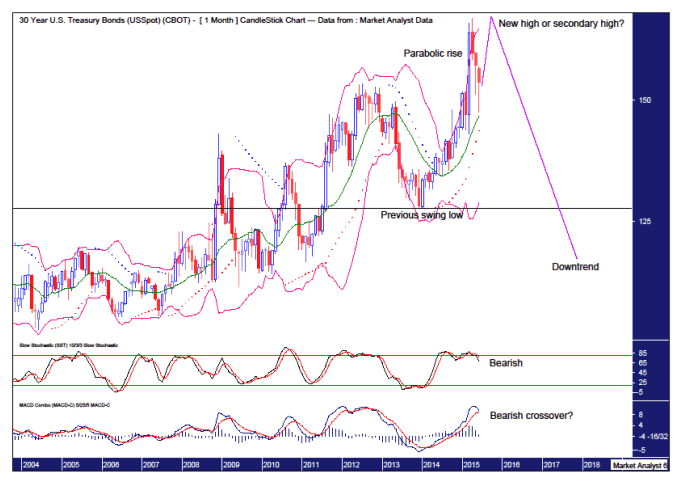
We can see the recent move up into high was parabolic in nature. This was due to price gapping up on the new contract shortly after a Federal Reserve meeting. Nevertheless, we play what the chart puts in front of us.
The Bollinger Bands show the recent high traded well above the upper band indicating a solid top. Another new high is certainly not out of the question and price now seems to be finding support at the middle band.
The recent low at 147.53 was also at support from the PSAR indicator denoted by the dots. These dots currently stand at 14378 and breaking this PSAR support now will likely indicate the bull market is over.
The Stochastic indicator is now bearish while the MACD indicator shows the averages coming back together threatening a bearish crossover. However, what often occurs is once the averages come back together price resumes higher as these averages turn back up together for one final fling.
So, price looks set to head back up one last time to test the high. This should set up a secondary high or one last marginal false break high. Until some support is broken I favour the latter.
Once that high is in place a downtrend should begin which will likely be confirmed by breaking below the previous swing low at 127.72 and is denoted by the horizontal line.
30YR US T-BONDS WEEKLY CHART
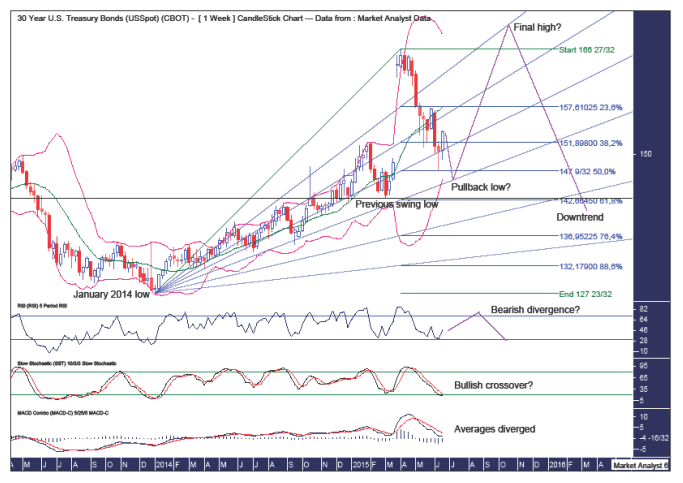
We can see price has pulled back from the recent high. I have drawn a horizontal line to denote a previous swing low at 142.97 and I would like to see price turn back up above this line thereby keeping the uptrend intact.
The Bollinger Bands show price just under the middle band while I suspect the final pullback low will be at support from the lower band.
I have added Fibonacci retracement levels of the move up from January 2014 low to recent high and price has recently turned back up just above the 50% angle. I favour a bit more work around this level while the previous swing low is right around the 61.8% level and if price were to make a low there then the expectation would then be to look for a secondary high.
I have drawn a Fibonacci Fan and I favour the pullback low to be at support from the 61.8% angle. And perhaps the final high will be back up at resistance from the 23.6% angle which, given a similar trajectory as the recent move up, looks set to occur around 170 in October this year. Let’s see.
The RSI made a new high at the recent price high and I would prefer to see this indicator make a bearish divergence at the final price high.
The Stochastic indicator is still bearish but looks to be threatening a bullish crossover.
The MACD indicator shows the averages have diverged somewhat and a rally shortly would bring them back together.
Let’s finish the bond price analysis by zooming in close at the daily chart.
30YR US T-BONDS DAILY CHART
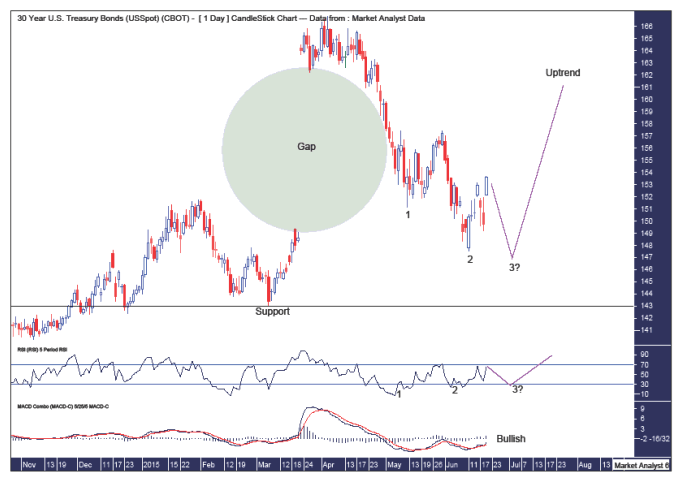
The green highlighted circle denotes the gap that has now been closed by price which is now free to head back up if that is what it desires.
There looks to be a “three strikes and you’re out” low formation in play denoted by the numbers 1, 2 and 3. We now just await the third low.
A third low now would likely set up a triple bullish divergence on the RSI which often leads to a significant rise in price.
The MACD indicator has a bullish bias and a new low would also likely set up a triple bullish divergence.
I have once again drawn a horizontal line which denotes support from the previous swing low. As long as price stays above this line then the expectation is for one final marginal false break top.
Now let’s analyse the technicals of bond yields using the monthly and weekly charts.
30YR US T-BONDS YIELD MONTHLY CHART
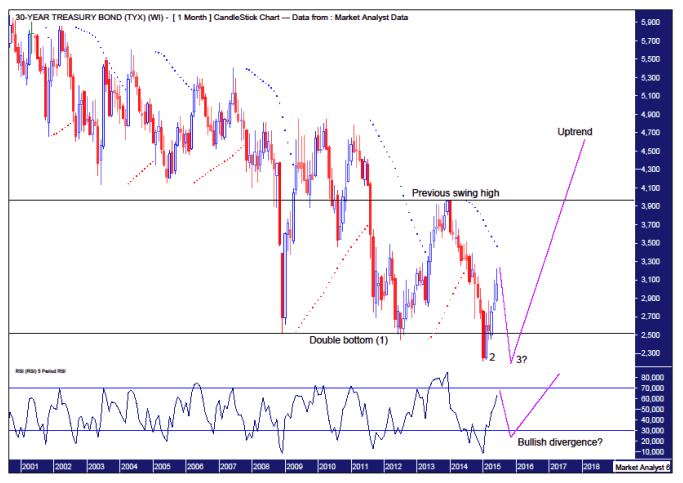
The lower horizontal line denotes a double bottom. Double bottoms generally don’t end trends and this was another one to bite the dust.
There looks to be a “three strikes and you’re out” low formation in play. I have combined the double bottom low to form the first strike while the recent low at 2.22% was the second strike. Now we just await the third and likely final strike low.
The PSAR indicator has a bearish bias with the dots above price and I would like to see price turn back down without busting this resistance. We’ll know one way or another shortly.
The recent low was accompanied by a new RSI low and I would prefer to see the final price low accompanied by a bullish divergence.
A new bull trend in bond yields or interest rates will likely be confirmed by price cracking above the previous swing high which is denoted by the higher horizontal line which stands at 3.39%.
30YR US T-BONDS YIELD WEEKLY CHART
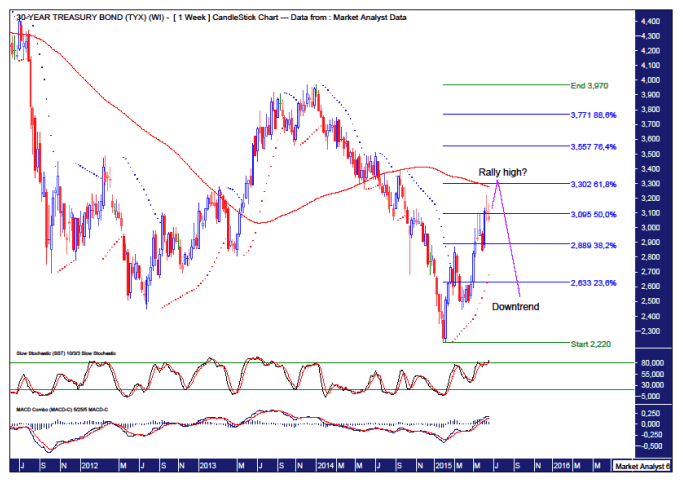
Previous analysis forecast this recent rise in interest rates but it now looks to be coming to an end.
The Stochastic and MACD indicators are both still bullish although they are looking towards the end of the moves.
The PSAR indicator has a bullish bias although the dots are becoming quite steep which is often seen at the end of moves.
I have added Fibonacci retracement levels of the recent move down and I favour the coming rally high to clip the 61.8% level which stands at 3.30%.
I have also added a 100 period moving average (red) which should act as resistance.
Once the rally high is in place I favour a swift move down to final low.
Summing up, the final phase of the massive bond bubble looks set to occur imminently and the bursting of this bubble will have catastrophic consequences for the world’s financial system. A new world order is coming…
By Austin Galt
Austin Galt is The Voodoo Analyst. I have studied charts for over 20 years and am currently a private trader. Several years ago I worked as a licensed advisor with a well known Australian stock broker. While there was an abundance of fundamental analysts, there seemed to be a dearth of technical analysts. My aim here is to provide my view of technical analysis that is both intriguing and misunderstood by many. I like to refer to it as the black magic of stock market analysis.
Email - info@thevoodooanalyst.com
© 2015 Copyright The Voodoo Analyst - All Rights Reserved
Disclaimer: The above is a matter of opinion provided for general information purposes only and is not intended as investment advice. Information and analysis above are derived from sources and utilising methods believed to be reliable, but we cannot accept responsibility for any losses you may incur as a result of this analysis. Individuals should consult with their personal financial advisors.
Austin Galt Archive |
© 2005-2022 http://www.MarketOracle.co.uk - The Market Oracle is a FREE Daily Financial Markets Analysis & Forecasting online publication.


