US House Prices Forecast 2008-2010
Housing-Market / US Housing Jun 29, 2008 - 12:29 AM GMTBy: Nadeem_Walayat

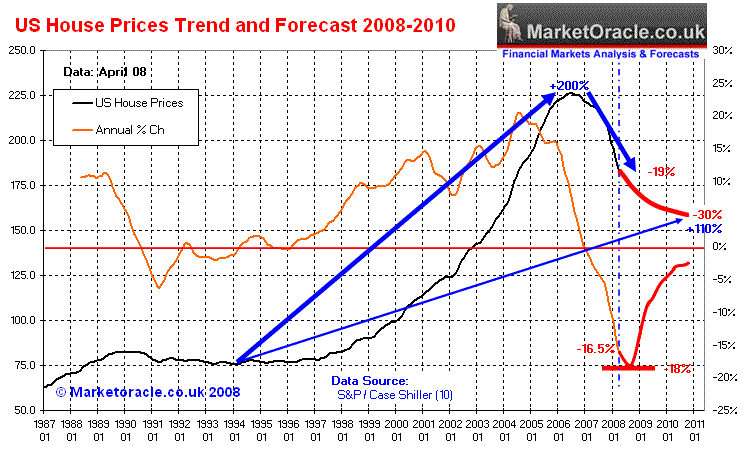
 US House prices continued to plunge for April 08 data, reaching an extreme low reading of down 16.3% on a year earlier as measured by the S&P/ Case-Shiller Composite-10 and down more than 19% from the mid 2006 peak. The rate of decline is the worst since the Great Depression and signals further distress in the real estate linked credit markets and therefore a continuing drag on the US economy in the face of the continuing deleveraging of the mortgage backed derivatives markets.
The housing market trend suggests that the annualised rate of house price falls could bottom at minus-18% for the July S&P/Case-Shiller house price data, therefore suggesting a continuation of the weakening trend in US house prices for the next 3 months (May,June,July data), after which the pace at which US house prices are declining 'should' improve as the current momentum is unsustainable beyond July 2008 due to sharp declines from a year earlier factoring into the annualised house price figures.

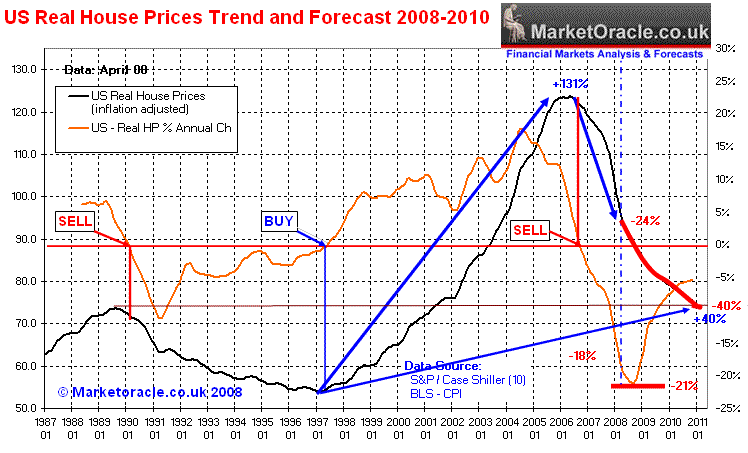
By the end of 2008, the annual rate of house price falls should slow to about 13%. Whilst it is not possible to forecast a bottom in the US housing market at this stage of the bear market, it is possible to come to the conclusion that most of the decline in nominal house prices is now behind us on the basis of analysis of the continuing decline in real-term house prices which suggests that a stabilising US housing market during late 2009 and 2010 will mask the continuing real terms inflation adjusted fall in the housing market valuations for several more years that will in effect have the impact of eroding all of the gains since the 1989 peak and reducing the gain from the 1994 low from 131% to just 40% by the end of 2010 as the below graph illustrates.

When to Buy? - The time to start contemplating buying real estate again will be after the US housing market has made a nominal bottom in house prices and at the time US house prices start to increase in real-terms as the BUY / SELL signals above illustrate. As per this analysis there is no sign of a BUY trigger occurring within the next 2 1/2 years.
Presidential Election - It is unlikely that there will be a significant turnaround in the annualised pace of house price declines by the November 08 election (September data) and therefore the falling housing market will continue to be a major negative factor for the Republican candidate despite the hundreds of billions being thrown at the housing market in an attempt at trying to put a floor under the housing market by reducing the number of foreclosures amongst adjustable rate mortgage holders resetting to higher interest rates.
US House Prices Forecast Summary - Nominal US House Prices are forecast to fall by 30% from the Mid 2006 peak by the end of 2010, or a further 11% on the decline of 19% to date. US house prices will continue falling in real-terms even if a low in nominal house prices is made by mid 2010.
For views on the UK housing market see the most recent article UK Housing Bear Market Threatening Economic Deflation
By Nadeem Walayat
http://www.marketoracle.co.uk
Copyright © 2005-08 Marketoracle.co.uk (Market Oracle Ltd). All rights reserved.
Nadeem Walayat has over 20 years experience of trading, analysing and forecasting the financial markets, including one of few who both anticipated and Beat the 1987 Crash. Nadeem is the Editor of The Market Oracle, a FREE Daily Financial Markets Analysis & Forecasting online publication. We present in-depth analysis from over 150 experienced analysts on a range of views of the probable direction of the financial markets. Thus enabling our readers to arrive at an informed opinion on future market direction. http://www.marketoracle.co.uk
Disclaimer: The above is a matter of opinion provided for general information purposes only and is not intended as investment advice. Information and analysis above are derived from sources and utilising methods believed to be reliable, but we cannot accept responsibility for any trading losses you may incur as a result of this analysis. Individuals should consult with their personal financial advisors before engaging in any trading activities.
Attention Editors and Publishers! - You have permission to republish THIS article. Republished articles must include attribution to the author and links back to the http://www.marketoracle.co.uk . Please send an email to republish@marketoracle.co.uk, to include a link to the published article.
Nadeem Walayat Archive |
© 2005-2022 http://www.MarketOracle.co.uk - The Market Oracle is a FREE Daily Financial Markets Analysis & Forecasting online publication.


