


Stock Market S&P 500: Is it This Simple?
Stock-Markets / Stock Markets 2015 Oct 12, 2015 - 03:51 PM GMTBy: Gary_Tanashian

 In an age of Algorithms, High Frequency Trading, Quant-injected performance engines and every Casino Patron with an e-Trade account hyper-stimulating the market after each bit of news that is fed (no pun intended) to us by the financial media and Policy Central, the lowly individual can be forgiven for feeling small and vulnerable; for feeling as if the answers are beyond her, or that long-term success is out of his reach.
Indeed, this very publication has ground its gears pondering the fact that August-September market sentiment became historically over bearish in ratio to the relatively minor downside experienced thus far. That was a bullish, not a bearish thing. With sentiment now being repaired it is time to ask if we are giving the bulls too much latitude.
The market bounce is proceeding along nicely. In fact it is proceeding a little bit too nicely (nicely enough to jerk the ‘Dumb Money’ sentiment up with it in lockstep to market price per the graph we reviewed in Friday’s update). Our bounce targets are now being reached, with SPX 2000 and 2020 in the books and the others waiting just above.
My question to you is what if it is so simple and not at all different this time? Let’s use the Presidential election years of 2000 and 2008 as examples. I am not a cycles analyst, but this is pretty simple. Clinton hands off a brewing mess to Bush, who in turn hands a disaster off to Obama. Now, who is going to take the ball, another 8 years on?
As always, charts will state the facts of what has happened before. So let’s compare the current S&P 500 to the two previous cycles using weekly charts. What we have below (current situation) is a breakdown, a classic double bottom and now an upside re-test. Does that look like a lot of overhead resistance to you? It does to me too.
The 50 week EMA supported the October 2014 decline after dropping below and hammering back above it. SPX is now at the EMA 50. That is generally the first notable resistance area. Next up is lateral resistance beginning at 2040 up to 2060. Beyond that, a spike (inverse to the downward one below the EMA 50 in Oct. ’14) to the pattern’s measurement around 2100 cannot be ruled out.
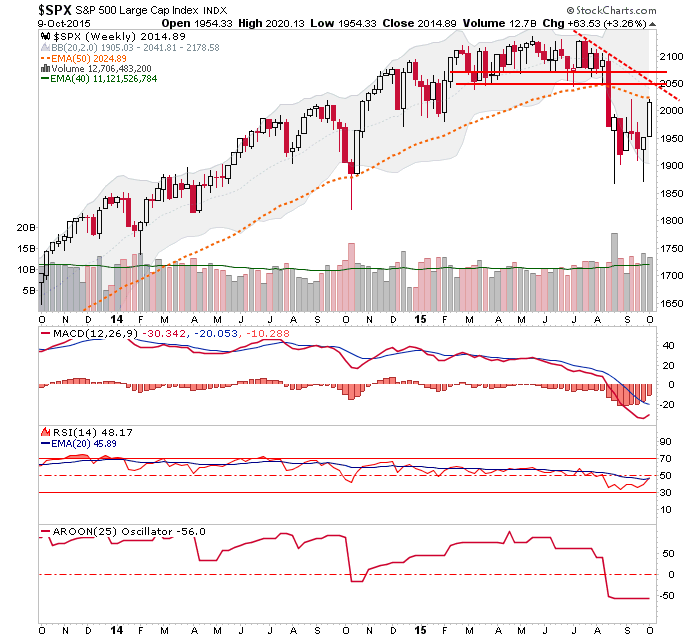
But as we noted in Friday’s update, the S&P 500 is bearish on an intermediate-term basis. In other words, if all goes the “simple” route, SPX is going to fail at one of these resistance points and set up the next bear opportunity. In market management, we should not chase hopes, aspirations, our own fears or fairy stories around. We should go by what we see. As of now, this is a bearish picture and until that changes this simple view should be respected.
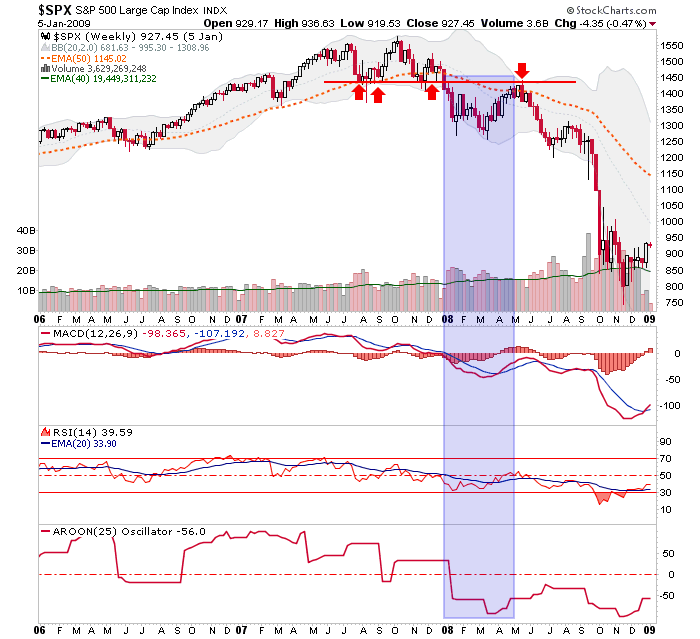
This is a chart from the 2008 cycle with the blue shaded area denoting the comparable to today’s rebound. As is the case today, price was rebounding to lateral resistance. This was the final kiss goodbye to the inflation-fueled bull market (2003-2007). The confirmation of the bull’s end came in mid-2008.
Note how MACD eventually triggered up and RSI went 50+ (still pending on today’s bounce), but AROON stayed down. The point is that in the current situation there could be some more building of hope (and firming of the bulls’ backbones) before a real bear opportunity arises. We’ll just have to take the technicals week by week.
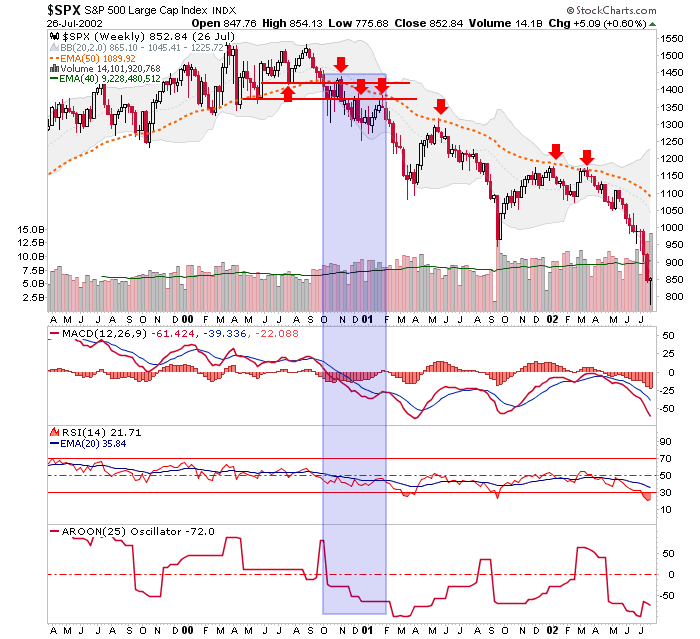
Let’s now dial in the 2000-2001 specimen. This one actually gave more warnings as the breakdown was tested 3 times before a fairly systematic bear market began. Unlike the impulsive purge that was 2008, this thing made its bones by grinding peoples’ bullish and bearish spirits with routine rallies and failures. It was very tradable in my experience.
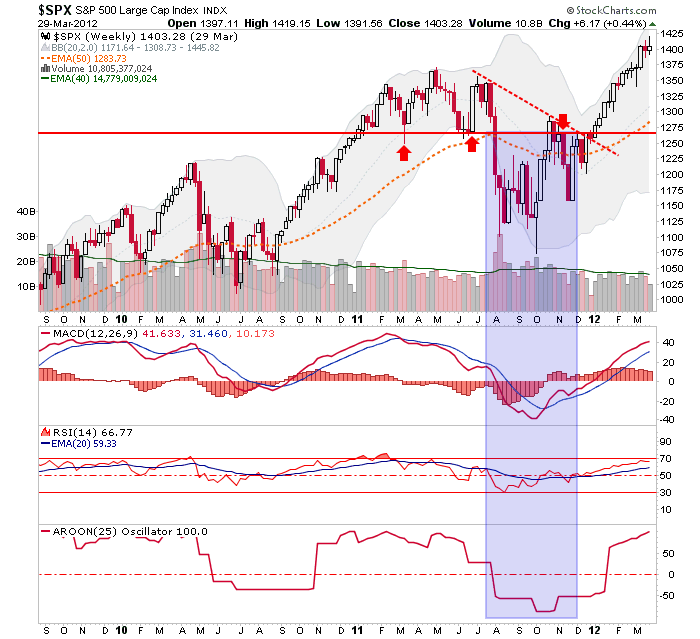
Finally, let’s take a closer look at the ‘comp’ we have noted previously in asking the question ‘is this 2011 or something worse?’
Ah ha! The classic re-test failed to confirm the bear case. This is the analog for today’s bulls who anticipate new manic highs after the recent sentiment clean out. Again, I respect sentiment more than almost anything else in the market’s bag of tricks, so I for one remain respectful of the bulls’ ability to turn August-September into a positive.
That would be the 5th wave up to a manic blow off scenario. However, hope is all this is right now because aside from the (roughly) 8 year Presidential cycle currently in play, as stated repeatedly, the intermediate trend is with the bears not the bulls. So the burden is on the bulls, not the bears, to prove their case.
The chart below shows that even the ultimately bullish 2011 comp was similar to its bearish fellows (incl. today’s)… until it wasn’t.
Bottom Line
If the current situation along with its 3 ‘comps’ were to unify on one conclusion, it is that the current bounce will likely find resistance fairly soon. It is what the next decline does that will either confirm or negate the bear case for SPX. The 2001 and 2008 comps declined from resistance and kept on going, while 2011 aborted and turned back up into a continuing bull market.
All 3 comps agree that there will be an initial down turn when SPX finds resistance. Even in 2011 that downturn was fairly sharp. 2 out of 3 comps agree that the current bounce will have turned out to be a ‘kiss goodbye’ to the bull. 1 comp would blow up firmly entrenched bears per 2011.
Going with the comps and considering markets are in a bearish weekly trend, we should prepare for the bear case, but although the probabilities do not favor it (technicals, cycles and even easing economic data), keep open a contingent bull case as events unfold.
NFTRH 364 then covered the usual weekly views of several US and global indexes, commodities, currencies, market sentiment and took an in-depth look at some short-term caution signals (within a still potentially constructive short-term trend, which itself is within what is still a technical bear market) in the precious metals along with strategies and targets.
Subscribe to NFTRH Premium for your 25-35 page weekly report, interim updates (including Key ETF charts) and NFTRH+ chart and trade ideas or the free eLetter for an introduction to our work. Or simply keep up to date with plenty of public content at NFTRH.com and Biiwii.com.
By Gary Tanashian
© 2015 Copyright Gary Tanashian - All Rights Reserved
Disclaimer: The above is a matter of opinion provided for general information purposes only and is not intended as investment advice. Information and analysis above are derived from sources and utilising methods believed to be reliable, but we cannot accept responsibility for any losses you may incur as a result of this analysis. Individuals should consult with their personal financial advisors.
Gary Tanashian Archive |
© 2005-2022 http://www.MarketOracle.co.uk - The Market Oracle is a FREE Daily Financial Markets Analysis & Forecasting online publication.