


Gold Forecast - Viewing Pullback in Gold as a Buying Opportunity - Global Watch
Commodities / Gold & Silver Mar 14, 2007 - 12:23 PM GMT

The Technical Picture of the Gold Price: The Gold Bullion Price expressed below is the price defining those of the Futures / Options / and Exchange Traded Funds, representing a portion of an ounce of gold. The $ price of gold is the one all market operators relate to, due to the $'s position as the present global Reserve Currency. Each Producer receives his income from gold in his local currency only as the host government of the mines exchange the income for local currency.
Likewise indian, European, et al, buyers of gold use their own local currencies when buying gold. Gold Forecaster , tracks the gold price in the different currencies.
![]() U.S. Dollar Gold Price
U.S. Dollar Gold Price
The Long-Term Technical Picture of Gold:
Looking to Target $730+ in 2007
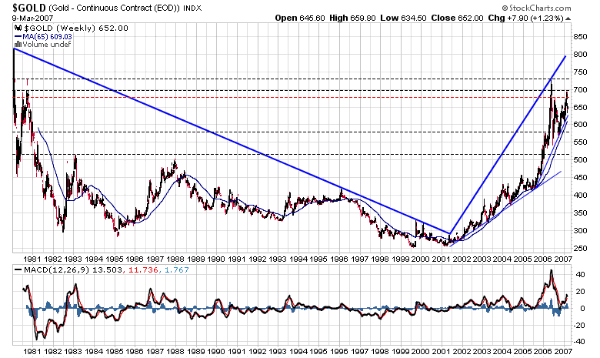
The long-term prognosis remains bright. Gold exceeded $675 resistance and moved to nearly $700 before making a sizeable fall with the general markets recently. With gold exceeding some key technical resistance before the correction, it has moved into a position so as to be ready to move much higher once this consolidation is over. This correction only put a short-term dent on the move up, allowing those to still enter below the $650 gold price before the market makes a move to and past the prior $730 record highs.
Terrific support is seen in the low to $600's, the market is making higher highs and higher lows since the lows around $250. The next major upside objectives remain $730, then $850 followed by $1,000.
As the market presents this pullback to us, continue to view it is an opportunity . The weekly charts continue to project extreme bullishness and this pullback is a healthy period of consolidation before the next objectives higher!
The Short-Term Technical Picture of Gold: Consolidation
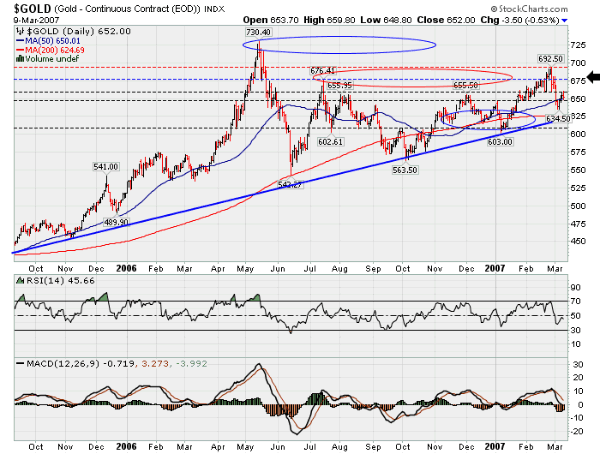
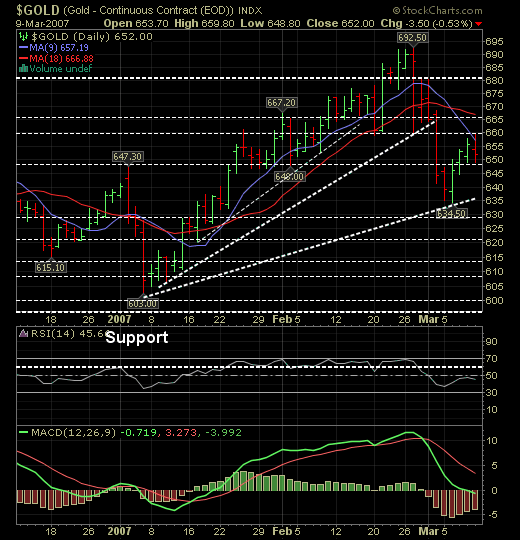
With the breakout past $676 to $692 and the violent fall back to $634, we received the expected bounce. We need to go through a period of consolidation until a firm foundation is made for the move up, drifting higher before we can see a resumption of the rally to $730. $655-660 remains a good area of resistance; a close above this is needed to retarget $675/$676 then $690-700. For now, good support is seen below and any moves below $650 appear to be quite a good risk/reward short-term play.
$700 then $730 remain upside targets and with the action over the past few months, the market is showing us that it is only a matter of time. If the market snaps back in the next week or two, then we will be in good shape, otherwise a period of consolidation - as mentioned above which now appears to be most likely. Volatility has been quite high and will remain with us, although it may settle down from the levels observed in late February into early March.
Pullbacks are very attractive at this time!
 Political risk
We have often written about the political risk facing miners in the emerging countries where most of the world's gold is mined. We began to alert Subscribers ahead of most of the dramas seen in these countries, so we thought it appropriate to encourage you to see that many company's are soundly based and able to contain political risk, with the major proportion of their production outside the high risk areas.
The Fraser Institute rates political risk in different countries and have recently published this years Policy Potential Index, measuring the best and the worst levels of political risk. The Democratic Republic of the Congo is the world's best mining locale, provided all remains as it is now. If memory serves us well this country in the last 50 years has seen one of the worst civil wars in history [remember Biafra / Katanga?]. Well under a 'democratically elected' government indicating a 'peaceful future' the institute's findings in its 2006/2007 report ranks the DRC 57 out of 65 in terms of policy potential index (PPI). In the 2005/2006 version of the report, the Fraser Institute said the DRC was the third least attractive mining destination.
In essence, the PPI is a composite measuring a host of metrics including political stability and bureaucratic consistency.
Zimbabwe ranks last, again as it should. Zimbabwe has been last since the 2004/2005 reports, and in 2005/2006 it reported the lowest ever points since the survey began in 1997. [We are surprised it has ever scored any points at all]
But in line with prospects for Africa in general, most of the African countries polled are getting lower rankings year-on-year. Remember that Africa remains Africa, with its inadequate infrastructure, political greed and change a continuous problem.
Botswana, Burkina Faso, Ghana, Mali, South Africa, and Tanzania have become less attractive to mining companies year-on-year. In the main it appears that their sin is on the bureaucratic and taxation fronts. An example of this is Zambia, but in the light of seeing the huge profits of the copper miners, which African country can resist upping taxes even on a 'windfall basis'. Zambia's government said royalties on mineral sales would be unilaterally increased to 3% from 0.6% regardless of whether a stabilization agreement had been signed with the investor.
 To emphasize the potential that exists in the DRC, the Fraser Institute provides a 'room for improvement' metric. On this scale, the DRC has the fourth biggest scope of improvement behind (in order of ranking) Russia, Mongolia and Bolivia.
So check the countries your investments mine in and weigh them against the total for the company to gauge your risks.
Please subscribe to www.GoldForecaster.com for the entire report.
By Julian D. W. Phillips
Gold-Authentic Money
Copyright 2007 Authentic Money. All Rights Reserved.
Julian Phillips - was receiving his qualifications to join the London Stock Exchange. He was already deeply immersed in the currency turmoil engulfing world in 1970 and the Institutional Gold Markets, and writing for magazines such as "Accountancy" and the "International Currency Review" He still writes for the ICR.
What is Gold-Authentic Money all about ? Our business is GOLD! Whether it be trends, charts, reports or other factors that have bearing on the price of gold, our aim is to enable you to understand and profit from the Gold Market.
Disclaimer - This document is not and should not be construed as an offer to sell or the solicitation of an offer to purchase or subscribe for any investment. Gold-Authentic Money / Julian D. W. Phillips, have based this document on information obtained from sources it believes to be reliable but which it has not independently verified; Gold-Authentic Money / Julian D. W. Phillips make no guarantee, representation or warranty and accepts no responsibility or liability as to its accuracy or completeness. Expressions of opinion are those of Gold-Authentic Money / Julian D. W. Phillips only and are subject to change without notice.
© 2005-2022 http://www.MarketOracle.co.uk - The Market Oracle is a FREE Daily Financial Markets Analysis & Forecasting online publication.