


Semi Bearish? - A Technical look at Semi Stocks and the Semiconductor Index
Companies / Tech Stocks Jan 02, 2016 - 02:06 PM GMTBy: Gary_Tanashian

 I must be bearish the Semi Equipment sector because I am short both LRCX and AMAT; the former a successful NFTRH+ long position that hit target and found resistance as anticipated by this chart originally included with the update. I am not so worried about the gap because it changed the trend and gaps that alter the trend of a stock can take a long while to fill.
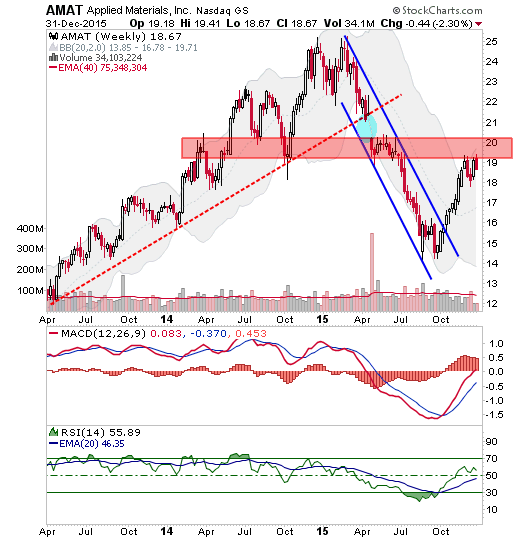
I went through all the reasons I am bearish the Semi Equipment sector in this post at NFTRH.com, so we don’t need to cover that ground again. The Equipment sector is decelerating, period. But the Semis are more than the Equipment guys, they are the chip makers too, or even especially.
Today I celebrated New Years by trudging through all of my NFTRH chart lists and getting rid of obsolete or non-essential ones and cleaning up and categorizing the standards that I want to move forward with. This included tons of indicators and several different markets (for example, I have a list devoted entirely to currencies and ForEx now). Yay me!
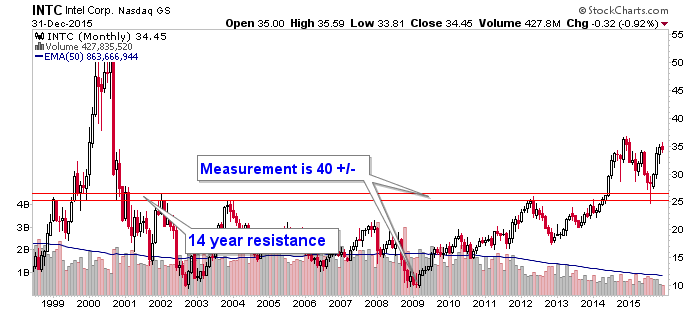
In going through the big picture monthly chart list I was forced to review some Semi charts as well, and it took me down memory (no pun intended) lane. For instance, long before the current crop of chart-based Semiconductor bulls appeared, another NFTRH+ update used this chart to spotlight an attempt to break resistance. The target was loaded then, in June of 2014. I don’t see much reason why the target may not be valid today (well, there is the declining volume post-2011).
This is about the point where I usually insert the part of about a guru-free zone and my ample number of calls (or whatever you’d call them) that don’t work out. The key there is risk management. I digress.
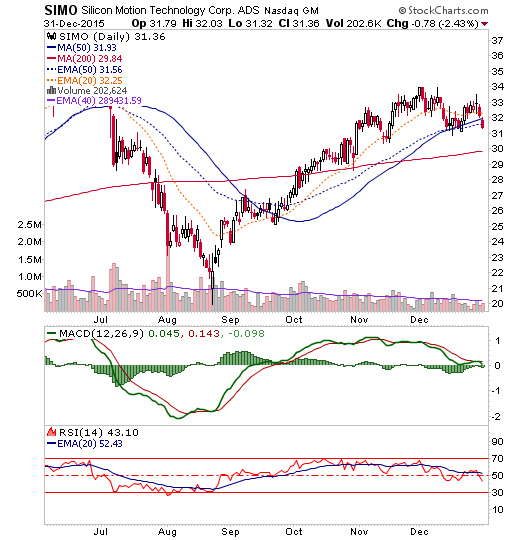
Intel is the daddy of chip makers. My favorite chip maker (fabless, mind you) has been Silicon Motion over the last few years. Here is the most recent + update on that one. I actually thought about buying it during last week’s market fade (which included an excellent bull trap for the more naive Santa participants) but then I looked at the daily chart and stayed away. That’s an unattractive short-term formation.
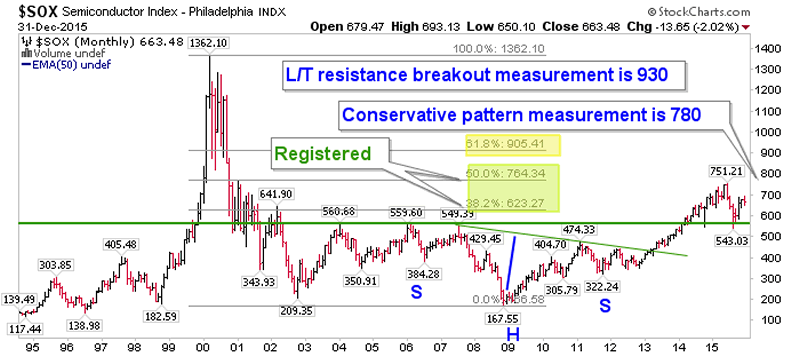
Moving on, during the chart clean out today I also came upon the monthly SOX index, which includes both the big equipment guys like Applied Materials and Lam Research and the big chip guys like Intel. Here is what the situation looks like with a couple of views (click the charts to get a clear view).
When the Semiconductor index (SOX) did what Intel did and broke long-term resistance we targeted upside, the highest of which has not yet come about. We can pretty much call an upward retrace of 50% in the books as the pattern measured () to 780. The next measurement was from the bottom in 2008 to the breakout line, again (). It, like Intel’s 40 level, is still open.
Here is another chart that used 1999 as an analog to what was going on back in 2013 into 2014. In 1999 the index crept up the top of the monthly Bollinger Band (20,2) in a precursor to a massive and manic blow off pretty much in line with other aspects of the tech sector. This was an early picture of what we were looking for as a clue to a stock market ‘manic up’ scenario. As you can see, this got temporarily neutralized in October 2014 and more convincingly neutralized last summer, and ‘manic up’ has (for this and other reasons) since been relegated to the back of the bus while the bear case drives.
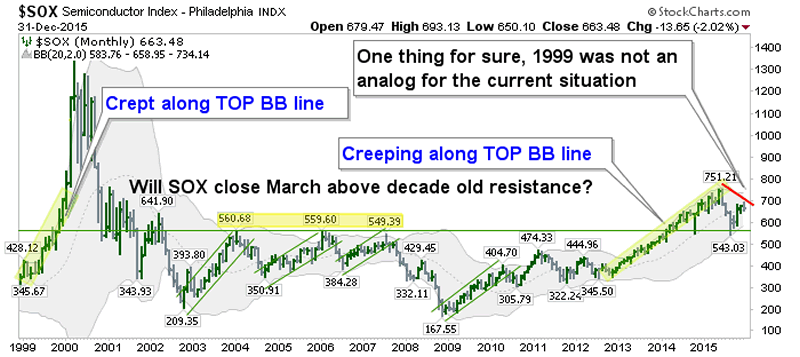
But SOX did do a classic test of support at 560. That was a good thing for the recent bounce (post September stock market bull suck-in/sentiment reset rally) prospects but it also formed a neckline. For all we know, the chip sector could take a good drop, find support again and one day proceed on to the best target. But if it happens, that is going to be one hairy test because people will start seeing the H&S and its neckline.
The previous post was mostly about the sector’s fundamentals. This one is entirely about its technicals. Fundamentally, I am bearish the Equipment makers and neutral (at best) the chip makers. Technically, I am neutral the sector.
Funny, the kinds of posts that spring up after wading through a million charts.
Happy New Year.
Subscribe to NFTRH Premium for your 25-35 page weekly report, interim updates (including Key ETF charts) and NFTRH+ chart and trade ideas or the free eLetter for an introduction to our work. Or simply keep up to date with plenty of public content at NFTRH.com and Biiwii.com.
By Gary Tanashian
© 2015 Copyright Gary Tanashian - All Rights Reserved
Disclaimer: The above is a matter of opinion provided for general information purposes only and is not intended as investment advice. Information and analysis above are derived from sources and utilising methods believed to be reliable, but we cannot accept responsibility for any losses you may incur as a result of this analysis. Individuals should consult with their personal financial advisors.
Gary Tanashian Archive |
© 2005-2022 http://www.MarketOracle.co.uk - The Market Oracle is a FREE Daily Financial Markets Analysis & Forecasting online publication.