


How The Fed is Suffocating The U.S. Economy
Economics / US Economy Jan 28, 2016 - 10:43 AM GMTBy: Clif_Droke

 Investors are worried over the prospects that the long-term momentum behind the stock market recovery of 2009-2015 may be in danger of complete dissipation this year. That would mean a certain date with an extended bear market and, potentially, an economic recession perhaps sometime later this year.
Normally, within the context of an established bull market, worry would be a good thing given that the bull tends to proceed along a "wall of worry." In view of recent actions undertaken by central banks, however, those worries are legitimate as I'll explain in this commentary.
There are two established ways of killing forward momentum and induce economic recession. One is to sharply reverse monetary policy or margin maintenance policy from very loose to very tight. An example of this is what happened in the months leading up to the 1929 crash; yet another example was the margin requirement tightening in the gold, silver and copper markets in 2011.
The other way of reversing forward momentum is to slowly suffocate the financial market through subtle, incremental policy shifts which favor holding cash over equities. The central banks of Europe and the U.S. have opted for the latter course. The ultimate outcome of this policy are being felt even now in Europe and elsewhere, but likely won't become abundantly clear in the U.S. until later this year.
Tight money policy, especially at a time when the financial market is vulnerable to overseas weakness, is nothing short of a recipe for disaster. Timothy Cogley, an economist with the San Francisco Federal Reserve Bank, admitted in a 1999 research paper that the Fed's tight monetary policy in 1928-29 likely contributed to the stock market crash of 1929. Cogley observed:
"In 1928 there was a synchronized, global contraction of monetary policy, which occurred primarily because the Fed was concerned about stock prices. These actions had predictable effects on economic activity. By the second quarter of 1929 it was apparent that economic activity was slowing. The U.S. economy peaked in August and fell into a recession in September." ["Monetary Policy and the Great Crash of 1929: A Bursting Bubble or Collapsing Fundamentals?"]
The Fed's mistake in those days was in trying to prevent a speculative bubble in the equity market. In so doing, however, the Fed inadvertently contributed to an even greater problem: the implosion of a speculative bubble. Moreover, the speculative bubble was fueled in part by a loose monetary policy in the years leading up to the 1928-29 run up in stock prices.
Cogley concluded: "In retrospect, it seems that the lesson of the Great Crash is more about the difficulty of identifying speculative bubbles and the risks associated with aggressive actions conditioned on noisy observations. In the critical years 1928 to 1930, the Fed did not stand on the sidelines and allow asset prices to soar unabated. On the contrary, its policy represented a striking example of The Economist's recommendation: a deliberate, preemptive strike against an (apparent) bubble. The Fed succeeded in putting a halt to the rapid increase in share prices, but in doing so it may have contributed one of the main impulses for the Great Depression."
While the Fed's recent quarter-point interest rate increase may seem insignificant at face value, the magnitude of the move can only be appreciated by realizing the rate of change involved. The following graph provides some idea of just how huge in percentage terms the Fed's policy tightening is.
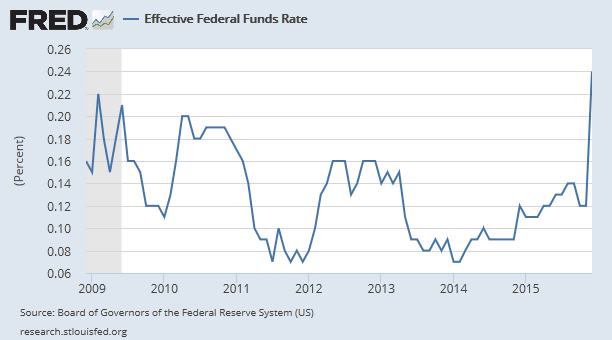
It's important to put this chart into its proper long-term context. The bull market which began in 2009 was largely fueled by a loose monetary policy, courtesy of then Fed Chairman Ben Bernanke. His successor, Janet Yellen, has reversed Bernanke's accommodative measures and seems intent on tightening the noose around the economy's throat.
Although many observers denigrate Bernanke's stimulus measures as being excessive, there can be no denying that they were successful in not only reviving the stock market and housing market, but also the overall economy to some degree. Many economists consistently underestimate the extent to which the U.S. economy is tied to the financial market. Yet the saying has never been more apropos than it is today: "As goes the stock market, so goes the economy."
Fed Chair Yellen evidently doesn't understand that truism. Her restrictive monetary policy, if pursued further, will eventually choke the last remnants of forward momentum in the economy, particularly in the manufacturing sector. Truly, now is the time the Fed should pursue an aggressively looser policy. As one observer put it, "With as much headway as the economy has made since 2009, why not open up the monetary floodgates and gun for prosperity?" Why not, indeed!
One of the biggest criticisms the Fed faced when it initiated quantitative easing (QE) and Operation Twist is that its loose policy would inevitably lead to runaway inflation. Yet here we are some seven years later and inflation is nowhere to be seen. Nay, deflation actually threatens the global economy and, by extension, aspects of the U.S. financial system. Why not then throw all caution to the wind and open up the monetary spigots full throttle? What have we possibly got to lose?
I've long maintained that the single biggest threat to the financial system is not an aggressively loose money policy, but an unjustifiably tight one. Everyone fears financial bubbles these days, but bubbles wouldn't necessarily lead to catastrophe if central banks and governments didn't consistently pop them by tightening money. While it's true that every bubble has its natural limit, they need not always end in catastrophic implosion. Indeed, bubbles in an economy as dynamic as ours are welcome events which bring quantum leaps forward in technological progress. They also tend to raise living standards for nearly everyone. One could argue that without the many bubbles of the last 30 or so years, America wouldn't enjoy her current high standard of living.
Let's now briefly turn our attention to the stock market outlook. While several reasons were given by analysts for the latest stock market rally attempt, the most common one was the hope for additional stimulus from the Bank of Japan and the European Central Bank (ECB). On Jan. 21, ECB President Mario Draghi indicated the bank would consider additional stimulus at its next meeting in March. Investors were elated by this statement, though it's surprising that the ECB is sufficiently unconcerned by the global financial crisis to wait until March before even considering action. If anything, Draghi's statement is a further testament to the complacency that's still rife despite the trillions of dollars in damage already inflicted by the crisis.
That word "complacency" seems to capture the prevailing sentiment among both retail investors and policymakers right now. Remember that in a bull market the "wall of worry" is what helps to establish the upward trend in stock prices. In a bear market it's the "slope of hope" that predominates. There seems to be a lot of "holding and hoping" going on right now, and that's not promising from a contrarian's perspective. We need to see a much bigger manifestation of fear, doom and gloom among mainstream investors before we completely cast our concerns about the bear aside.
Another aspect in great need of improvement is the market's internal momentum picture. Since last spring, the number of stocks making new 52-week lows on the NYSE has consistently been above 40. That's a sign that internal weakness is still present in the broad market. Moreover, the important 200-day rate of change in the new highs-new lows has been declining now for over a year. The last time this happened was heading into the 2008 bear market. The following graph shows the enormity of the decline in this indicator since last year.
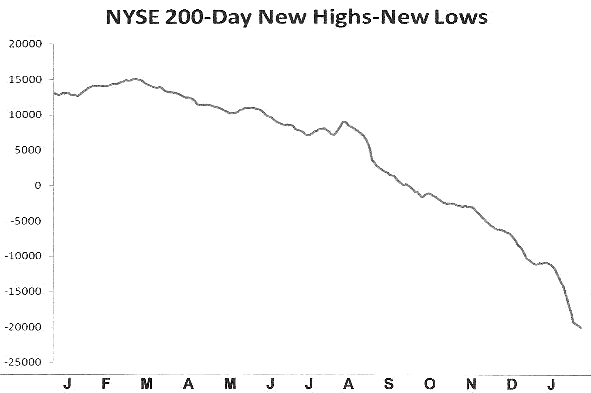
As long as this indicator is declining it's warning us that there is a significant undercurrent of weakness within the market. This indicator will obviously need to improve before we have any indication that the bear market is ending and a new bull market is forming. Until then, a continued defensive stance is warranted for long-term investors.
Mastering Moving Averages
The moving average is one of the most versatile of all trading tools and should be a part of every investor's arsenal. Far more than a simple trend line, it's also a dynamic momentum indicator as well as a means of identifying support and resistance across variable time frames. It can also be used in place of an overbought/oversold oscillator when used in relationship to the price of the stock or ETF you're trading in.
In my latest book, Mastering Moving Averages, I remove the mystique behind stock and ETF trading and reveal a simple and reliable system that allows retail traders to profit from both up and down moves in the market. The trading techniques discussed in the book have been carefully calibrated to match today's fast-moving and sometimes volatile market environment. If you're interested in moving average trading techniques, you'll want to read this book.
Order today and receive an autographed copy along with a copy of the book, The Best Strategies for Momentum Traders. Your order also includes a FREE 1-month trial subscription to the Momentum Strategies Report newsletter: http://www.clifdroke.com/books/masteringma.html
By Clif Droke
www.clifdroke.com
Clif Droke is the editor of the daily Gold & Silver Stock Report. Published daily since 2002, the report provides forecasts and analysis of the leading gold, silver, uranium and energy stocks from a short-term technical standpoint. He is also the author of numerous books, including 'How to Read Chart Patterns for Greater Profits.' For more information visit www.clifdroke.com
Clif Droke Archive |
© 2005-2022 http://www.MarketOracle.co.uk - The Market Oracle is a FREE Daily Financial Markets Analysis & Forecasting online publication.