


Did AMAT Chirp? Implications for the Economy and Gold
Stock-Markets / Financial Markets 2016 May 23, 2016 - 12:50 PM GMTBy: Gary_Tanashian

 The following is the opening segment of this week's Notes From the Rabbit Hole, NFTRH 396. The report also covers, in detail, the technical status of US/Global stock markets, precious metals, commodities, currencies and even a few individual gold miners and a couple of new (non-gold related) NFTRH+ trade ideas.
In January of 2013 we noted that the "Canary's Canary" chirped and signaled an economic up phase (such as it was) on the horizon. The Canary was the Semiconductor sector, which is cyclical and economically sensitive. The Canary's Canary is the Semi Equipment sector, manned by the likes of Applied Materials and Lam Research.
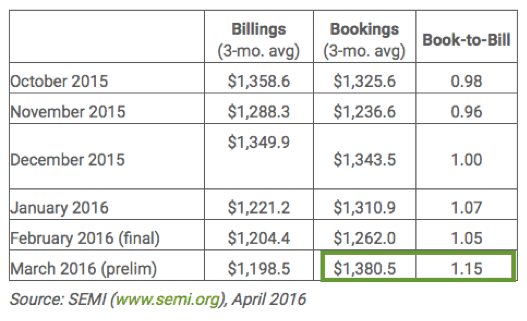
On Friday the market got a nice quarterly report from AMAT as it beat estimates across the board and offered positive guidance. The broader market used it as an excuse to at least temporarily neutralize a perfectly good (daily) bearish pattern on the S&P 500. AMAT received $3.5 Billion in new orders, which is up 37% from last year. Now, does this rhyme with something we have reviewed recently? Recall that the March Book-to-Bill ratio ('b2b', shown below) for the Semi equipment sector was positive and more importantly than that, the 'bookings' side of the equation was strong. The next b2b is due to be released on May 24 and it will be a key to our analysis going forward.
Display and NAND Flash memory chips saw big jumps while DRAM floundered. This illustrates why more modern, specialty chip companies are doing well and dinosaurs are lagging. But is it an economic signpost? I have created new multi-paneled charts with relevant gold ratios and this seems like a convenient time to introduce them. So lets interrupt the Semi discussion and see how the counter-cyclical theme is shaping up.
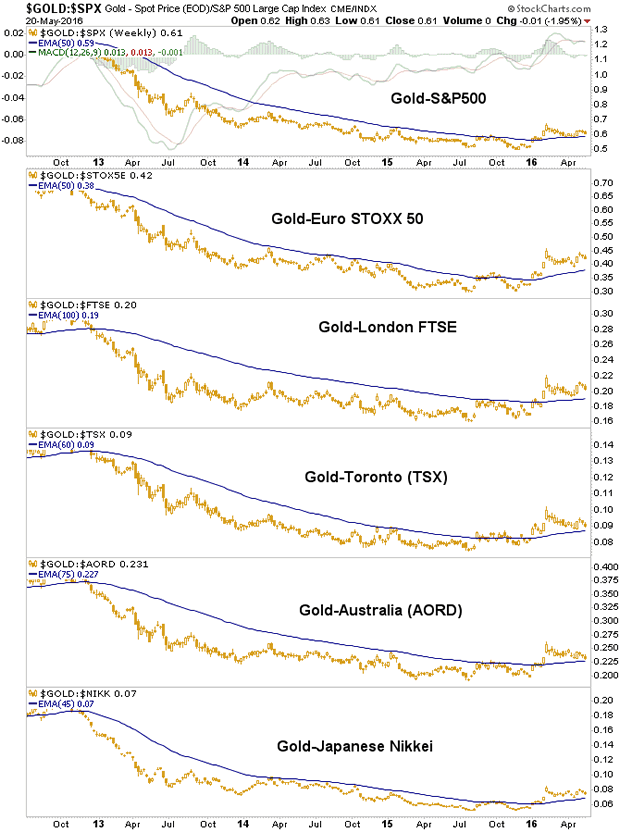
Gold vs. stock markets (counter-cyclical indicator) has been flat to down for several months now as markets positively correlated to the global economy have experienced relief. That is fine, we knew it would happen. At this time Au-Stocks remains on a counter-cyclical theme (above the moving averages), but it is being tested.
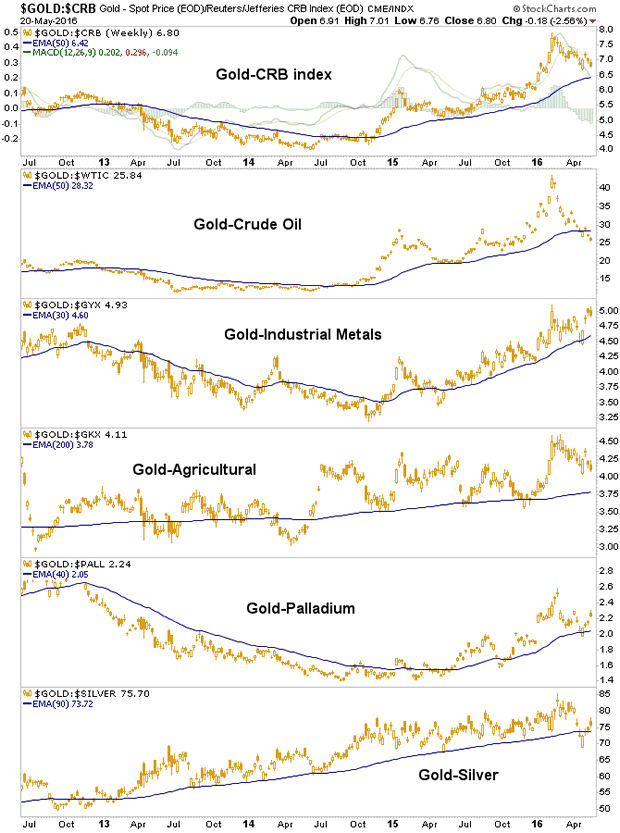
Gold vs. commodities was the earliest counter-cyclical indicator, bottoming in 2014 (whereas gold vs. stocks bottomed at the end of 2015). Up trends abound, especially vs. industrial metals. But gold vs. crude oil continues to drop and that is a drag, not only to the gold mining sector's cost structure, but can also be watched as an early indicator on whether the counter-cyclical (and anti-inflationary) environment will remain intact.
So I ask gold bugs among the NFTRH subscriber base, what happens if the Semi equipment b2b comes in strong again on Tuesday? What do we then do if gold vs. stock markets and certain commodities continues to weaken and fail the tests of support that it is now on?
I ask these questions as Devil's advocate, not as a predictor of coming events. Right now each of the chart panels remain above moving average breakout support (Au-Stocks) or new 'higher highs, higher lows' up trends (Au-Commodities). But I will ask the question again if Tuesday's b2b comes in strong. Remember, the Semi equipment cycle is a very early economic cycle indicator. Is this a false positive or a new trend?
One positive month on bookings does not a trend make, but a second positive month would have to open the discussion (again, we'll know more come Tuesday) and a third month (data to be released in June) would be a trend.
Traveling back in history again, nobody was talking about the prospect of a new economic up cycle in January of 2013. We were. Last summer, nobody was talking about a coming change to a counter-cyclical environment that could launch the gold sector. We were (the 'Macrocosm' theme was introduced in July).
By the eye test the gold "community" is over bullish. Even the ones predicting an imminent correction are now long-term bullish on gold. And yes, the gold ratio charts above show that is the way to be right now. Even if the 'gold vs. commodities' charts break down gold itself may do just fine if a persistent inflationary environment were to engage, because that would be consistent with a positive message in Semiconductors and an (inflation-fueled) economic bounce. But gold mining would become suspect vs. its peers in an 'inflation trade'. History has shown the miners can rise a long way while under suspicion, but we will call the fundamentals as we see them every step of the way.
We are using the Greenspan era as a blue print. That 'inflation bull' was launched from a similar backdrop to what has been going on so far in 2016; i.e. a counter-cyclical (in that case, the 2001-2002 recession) environment.
We should not use one report from one Semi equipment company as anything remotely like a be all, end all. But as we have shown routinely, Semi leadership broke down last summer and has remained in breakdown mode vs. the S&P 500. Is this (the AMAT report) the Canary's last gasp or something more musical to the ears of stock market players and even possibly, inflationists (investing for inflation-fueled economic growth)? I will seek input from my industry contact and we'll see what, if any kind of a case we might build. The trend remains with 'counter-cyclical', but trends do change eventually.
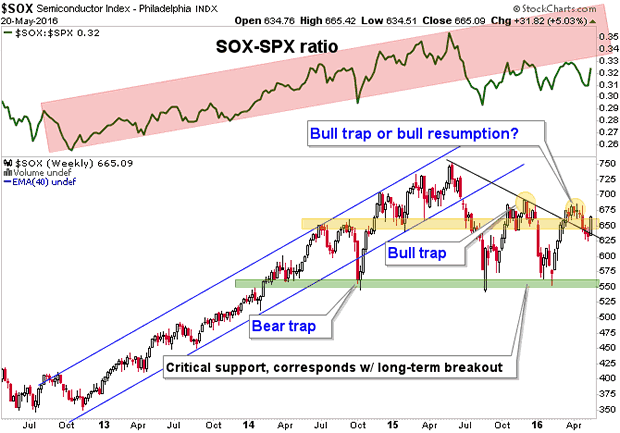
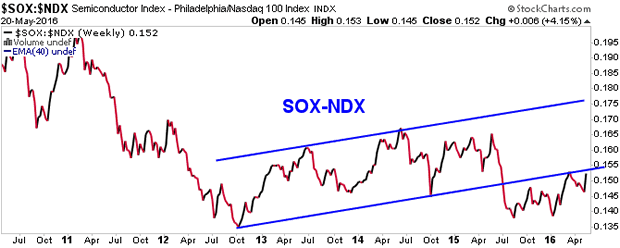
SOX-SPX above and SOX-NDX below are still each in post-2012 'leadership abdication' mode, technically speaking. If that changes and the Book-to-Bill changes trend, we will need to evolve our plans from counter-cyclical to 'inflationary growth', which was the phase that held sway for several years into the big market top in 2007.
Post Script to the public version of this article...
Analysis like this tends to be early to the party, as it was in January of 2013 well before the economic turnaround (such as it was) had become obvious to a majority. Indeed a challenge I continually have is to read signals yet remain in the moment of what is happening in the here and now and what the herd is doing. Right now the herd has gold fever and to this point at least, that has been the right stance as indicated by the first two charts above, among other things.
Subscribe to NFTRH Premium for your 25-35 page weekly report, interim updates (including Key ETF charts) and NFTRH+ chart and trade ideas or the free eLetter for an introduction to our work. Or simply keep up to date with plenty of public content at NFTRH.com and Biiwii.com.
By Gary Tanashian
© 2016 Copyright Gary Tanashian - All Rights Reserved
Disclaimer: The above is a matter of opinion provided for general information purposes only and is not intended as investment advice. Information and analysis above are derived from sources and utilising methods believed to be reliable, but we cannot accept responsibility for any losses you may incur as a result of this analysis. Individuals should consult with their personal financial advisors.
Gary Tanashian Archive |
© 2005-2022 http://www.MarketOracle.co.uk - The Market Oracle is a FREE Daily Financial Markets Analysis & Forecasting online publication.