


Stock Market Challenging the High
Stock-Markets / Stock Markets 2016 Jul 11, 2016 - 09:51 AM GMTBy: Andre_Gratian

 Current Position of the Market
SPX Long-term trend: The long-term trend is near its all-time high
SPX Intermediate trend: The uptrend from 1810 is now challenging the 2135 high.
Analysis of the short-term trend is done on a daily basis with the help of hourly charts. It is an important adjunct to the analysis of daily and weekly charts which discuss longer market trends.
CHALLENGING THE HIGH
Market Overview
Last week, SPX traded within inches of its all-time high. After a much better than expected jobs report on Friday, bulls took control and drove the SPX up to 2131.71, only 3 points from the 5/15 high of 2134.72. Some profit-taking occurred in the last minutes, and it closed at 2129.39. This puts it at the very top of the resistance band which has defeated all attempts at making a new high for the past 14 months. Will this one succeed?
To be completely objective, the jury is still out! By Friday's close, varying degrees of negative divergence plagued all oscillators, from weekly to hourly. As we know, negative divergence is only a warning that momentum is waning. It does not predict with certainty that the move will end. So we must wait until Monday to see if the bulls will have enough enthusiasm left to drive SPX to a new high. Eric Hadik is expecting cycles to peak around the middle of the month, and with short-term P&F counts ranging from 2136 to 2158, the odds are pretty good that a new high will become a reality. Also, we cannot ignore the fact that the 1810 base does carry an unfilled count to 2240 (minimum).
Stock market conditions are always changing, so we can only predict with some confidence what lies directly in front of us. Being aware of the existing divergences and short-term count implications, we should reasonably expect that the current rally from the Brexit low of 1991 will end shortly and some retracement will follow. Whether the longer-term projections to 2240 or higher will ever materialize is only a possibility which will have to be determined by future market action.
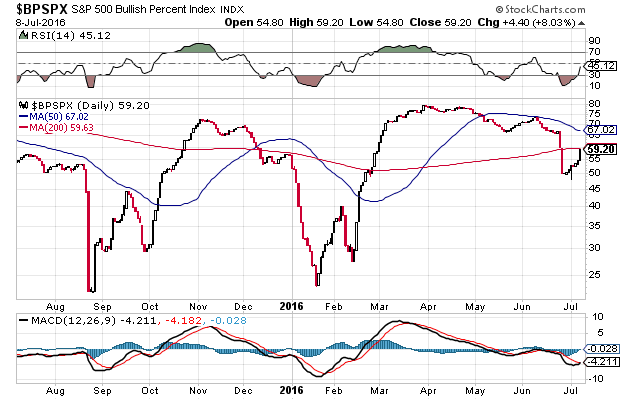
Last week, I showed a chart of BPSPX which showed a stark contrast to that of the S&P 500. While analyzing it, I mentioned "We'll have to watch it closely over the near term to see if it makes a late recovery. Perhaps there has not been enough time!"
Here is an updated version of the same chart (courtesy of StockCharts.com): As you can see, it has somewhat improved, but it has only gone from about 52% to 59%, which leaves it showing extreme divergence with its 80% high of April, and the more recent 67% before the Brexit plunge.
What can we deduce from this relative performance? Nothing certain! Only caution that everything may not be what it appears to be when judged by the SPX performance.
SPX Chart Analysis
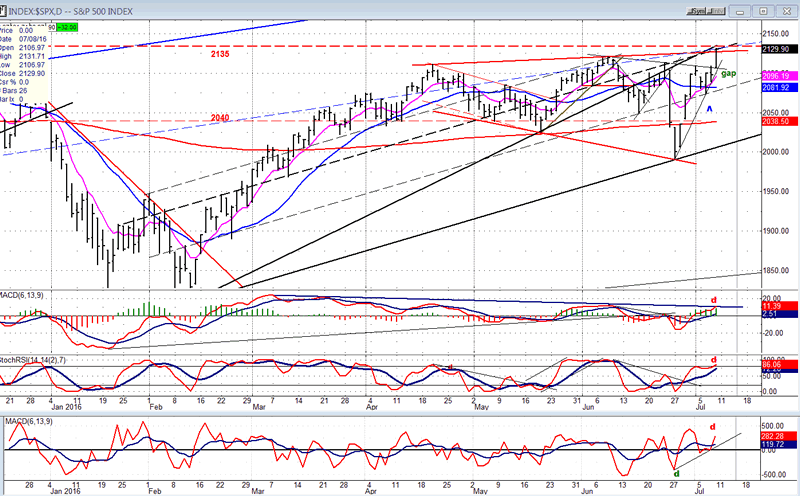
Daily chart
The original trend line from 1810 was broken in mid-June, followed by a rally which made several unsuccessful attempts at breaking back above it, but only turned out to be back-tests of that trend line. The rally from the Brexit low is now approaching the same trend line where it could, once again, find some resistance and back off. There are several other lines converging on that very spot which could add to that resistance. This, combined with the previous resistance which exists from trading at the former highs could make it difficult for SPX to make a new high right away, and additional consolidation may be required to absorb all the selling at this level. We must also question the nature of Friday's rally which was characterized by low volume, divergences, and the probability that it was fueled to a great extent by short-covering.
In addition, the momentum oscillators are not yet confirming a breakout pattern. In fact, they are showing negative divergence when compared to the June high. Of course, all these negatives could quickly disappear if there is some good follow-through on Monday.
This chart and others below, are courtesy of QCharts.com.
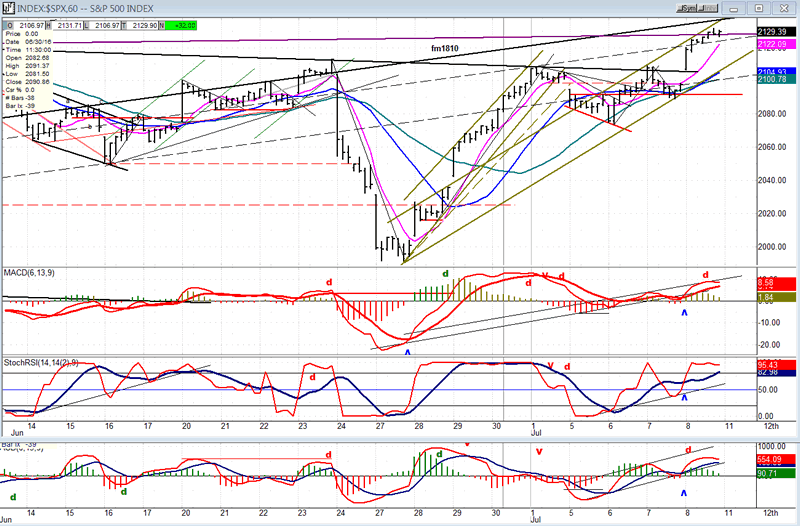
Hourly Chart
The initial rally from 1810 consisted of 118 points which formed a steep uptrend. After a minor correction, the index started to move back up and found resistance at a shallow trend line which caused price to retrace on Thursday, after which it seemed to wait for Friday's jobs report to determine what the next near-term trend should be. By now, the initial steep rally had moderated to a more normal advance within a narrow channel. When prices exploded on Friday morning, they quickly moved to the top of that channel but could not go beyond it and spent the rest of the day in a narrow range just below. The top line of that channel adds resistance to that pointed out on the daily chart, making it imperative that there should be a strong opening on Monday morning to pierce through the resistance if we are to make a new high.
At the 60m time frame, oscillators show even more divergence than the daily ones and they have even begun to roll over, but they have not given a sell signal, leaving it for Monday to decide if the index should immediately resume its upside momentum or if it requires additional consolidiation first.
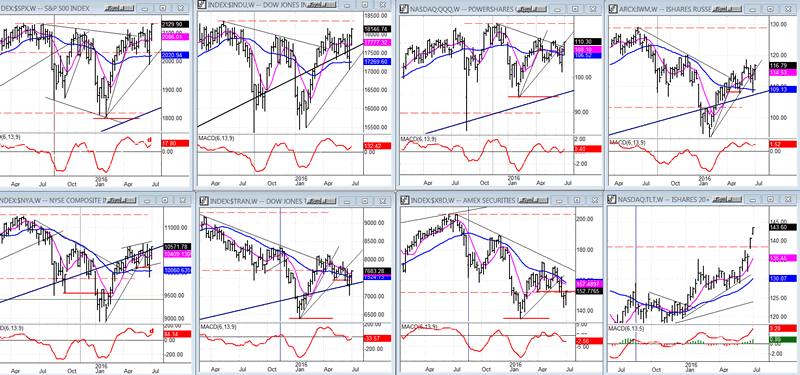
SPX et al... (weekly)
Currently, the collective relative performance of these leading indexes to SPX gives us a good reason to wait for confirmation that the buying that we saw on Friday will lead to a new high and, if so, by how much.
The only index which comes close to matching near and longer term action in SPX is the DJIA. The others, starting with QQQ, show various degrees of relative weakness, with the two worst performers being the TRAN and XBD. At the same time, TLT spent the last two weeks trading at an all- time high.
What are we to make of this? Can SPX really make a meaningful new high in this market environment and is this sort of comparison even valid today? Surely TLT, which represents money seeking safety, making new all-time highs is inconsistent with SPX, a risk asset, making new highs at the same time! I will leave it to others to speculate about whether or not there is a "rational" explanation for this disparity.
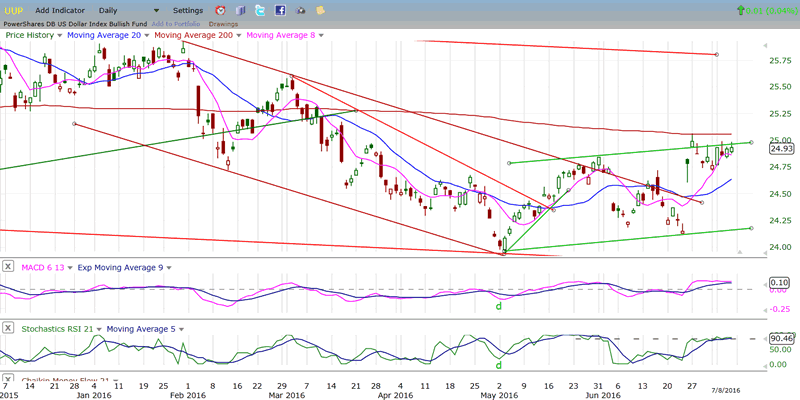
UUP (dollar ETF)
UUP had a decisive break-out of its intermediate-term channel but found resistance to any further immediate advance from several sources, including the top of its green channel, the 200-MA, and overhead congestion which had formed around March. The fact that it only had a tepid response to Friday's very strong jobs report suggests that it may need additional consolidation before continuing its uptrend.
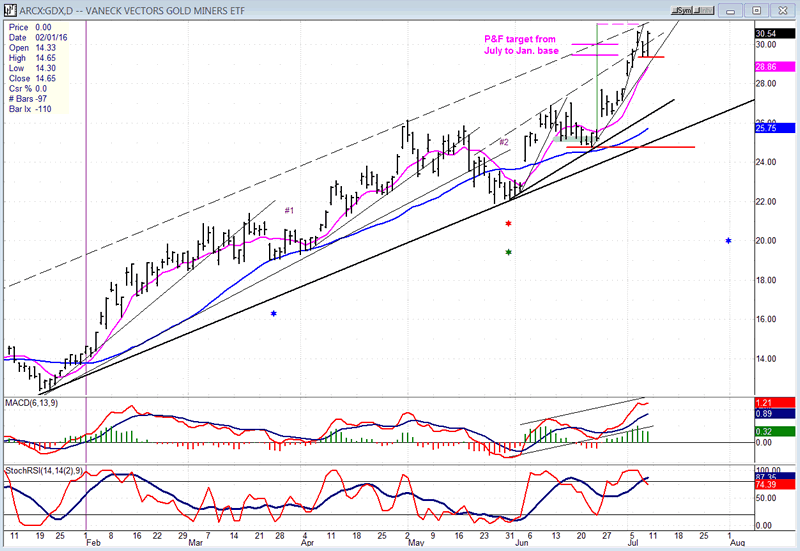
GDX (Gold Miners ETF)
Last week, I suggested that while the base count suggested a target of 29.50, the re-accumulation level at 24.50 could carry GDX to about 30.50, which is what it reached last week (30.68) before it encountered resistance; 31 may even materialize before this move comes to an end.
The past three days have started to form a congestion pattern on the P&F chart which should turn out to be distribution if my analysis is correct. If we reach 31 and reverse, look for a decline to start which could continue into the end of the month before ending. If it materializes, projections will be given to subscribers -- including trial subscribers.
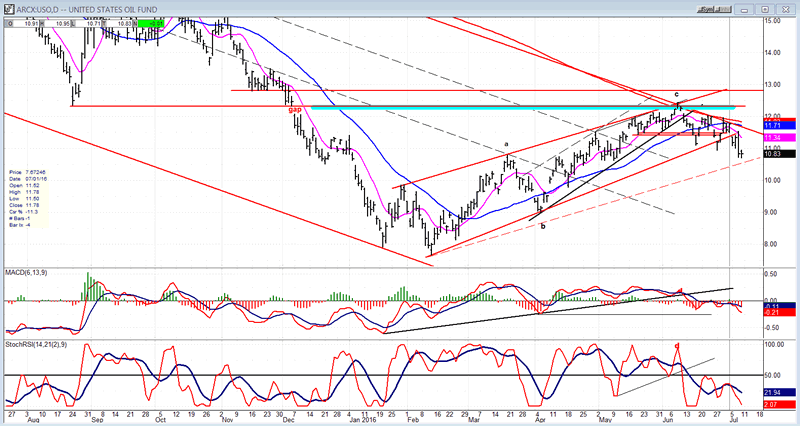
USO (US Oil Trust)
After an oversold rally from what is likely to be a long-term low of 8, USO reached its logical upside target and filled an important gap. Since then, it has broken an intermediate uptrend line. It could find support on the dashed bottom channel line since it corresponds to a .382 retracement of its advance, but if that does not hold, it will most likely enter an important base building process which will require completion before it can start a new uptrend.
Summary
The powerful post-Brexit rally ended after a 118-point advance and was followed by a shallow consolidation. Additional fuel was provided by an unexpectedly bullish jobs report which drove the index close to the former high.
By Friday's close, there were signs that SPX was running into strong resistance, with some negative divergence showing in all three time frames (weekly, daily, and hourly). Some of these can be easily overcome by another push on Monday which would take the index to a new all-time high, but how much higher can it go? Short-term projections suggest that additional advance from here will be limited in scope.
There are potential projections that could drive SPX much higher but, to make such progress, badly lagging segments of the market will have to show renewed strength.
Andre
FREE TRIAL SUBSCRIPTION
If precision in market timing for all time framesis something that you find important, you should
Consider taking a trial subscription to my service. It is free, and you will have four weeks to evaluate its worth. It embodies many years of research with the eventual goal of understanding as perfectly as possible how the market functions. I believe that I have achieved this goal.
For a FREE 4-week trial, Send an email to: info@marketurningpoints.com
For further subscription options, payment plans, and for important general information, I encourage
you to visit my website at www.marketurningpoints.com. It contains summaries of my background, my
investment and trading strategies, and my unique method of intra-day communication with
subscribers. I have also started an archive of former newsletters so that you can not only evaluate past performance, but also be aware of the increasing accuracy of forecasts.
Disclaimer - The above comments about the financial markets are based purely on what I consider to be sound technical analysis principles uncompromised by fundamental considerations. They represent my own opinion and are not meant to be construed as trading or investment advice, but are offered as an analytical point of view which might be of interest to those who follow stock market cycles and technical analysis.
Andre Gratian Archive |
© 2005-2022 http://www.MarketOracle.co.uk - The Market Oracle is a FREE Daily Financial Markets Analysis & Forecasting online publication.