


Gold and Crude Oil - General Stock Market Links
Commodities / Crude Oil Oct 12, 2016 - 04:58 PM GMTBy: Nadia_Simmons

 Without a doubt the most important event of the recent month (or even the recent years) was unexpected OPEC’s decision to limit its production to a range of 32.5-33.0 million barrels per day. The agreement reached in Algiers (which is expected to be implemented this year) improved oil investors’ sentiment and pushed the price of crude oil above the barrier of $50. But is it enough to break above the Jun peak? Is it possible that the relationships between crude oil, gold and the general stock market give us more clues about future crude oil’s moves?
Let’s jump right into charts (chart courtesy of http://stockcharts.com) and find out.
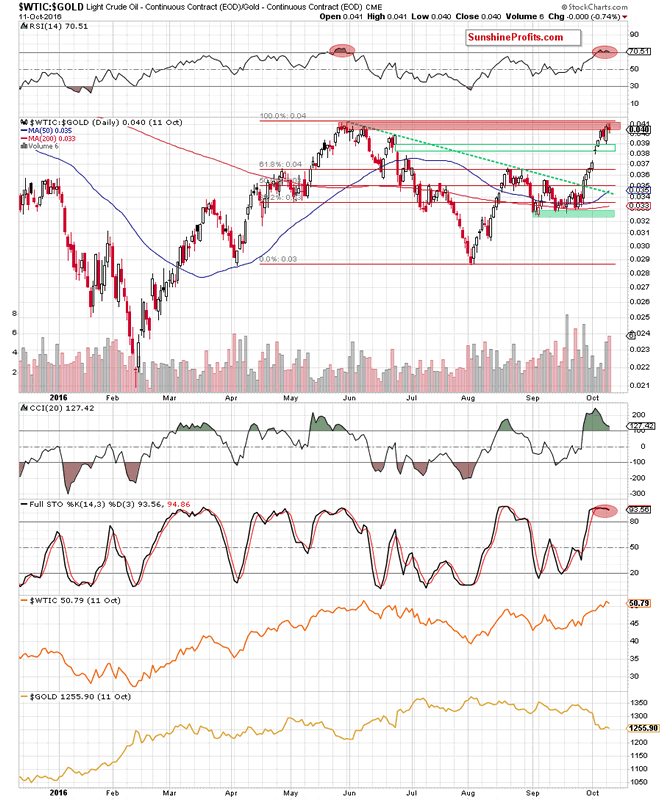
Looking at the daily chart, we see that the ratio moved sharply higher in recent days, which resulted in a bullish gap in the previous week. This event triggered another upswing, which closed the bearish gap from Jun 24 and encouraged bulls to further action. Thanks to these circumstances, we saw a rally, which approached the ratio to the red resistance zone based on May and Jun highs. What can we expect in the coming days? Taking into account the proximity to this important resistance zone and the current position of the indicators (the RSI climbed above the level of 70, the CCI moved lower, creating a negative divergence between itself and the value of the ratio and the Stochastic Oscillator generated a sell signal), we think that reversal is just around the corner.
How did this move affect the medium-term picture? Let’s check.
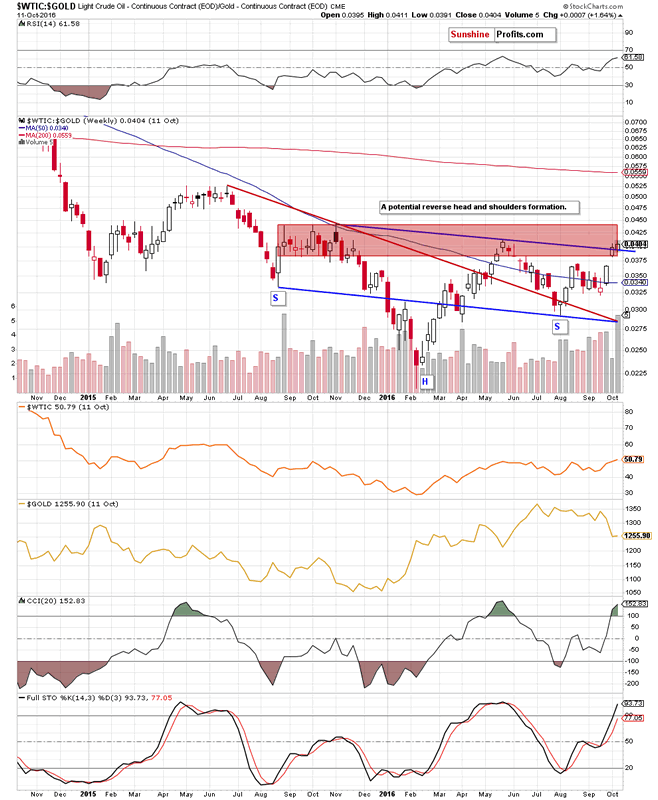
The first thing that catches the eye on the weekly chart is a breakout above the neck line of a potential reverse head and shoulders formation. Although this is a bullish signal, we should keep in mind that there was a similar price action in the previous week. Back then, bulls didn’t manage to hold gained levels, which resulted in a pullback. Therefore, in our opinion, this week’s breakout would be more reliable only if the ratio closes this Friday’s session above 0.04.
Once we know the above, let’s take a closer look at the relation between oil and the general stock market.
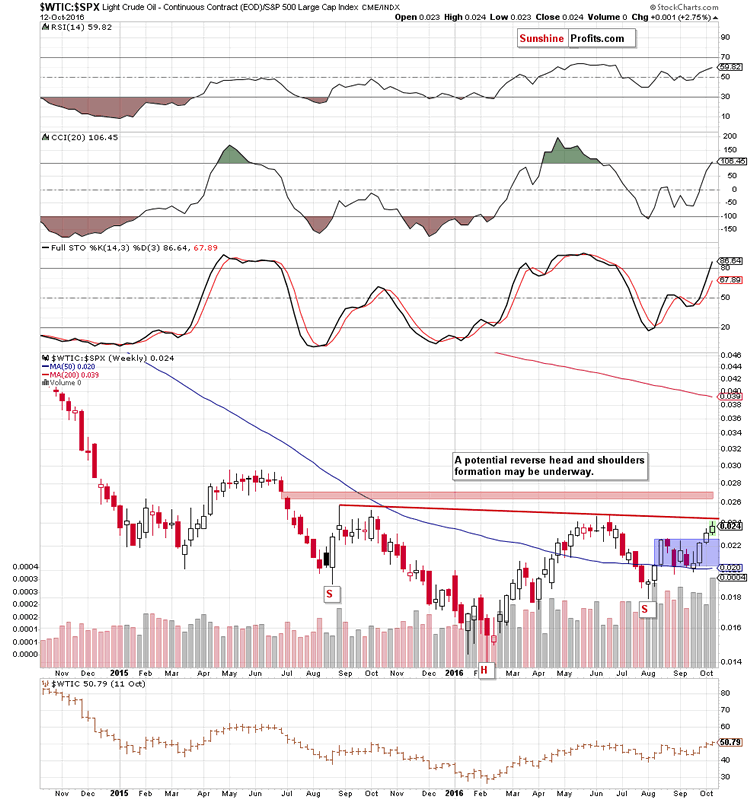
On the weekly chart, we see that although the ratio broke above the upper border of the blue consolidation, the red resistance line based on the Aug 2015 and Jun 2016 highs (a neck line of a potential reverse head and shoulders formation) continues to keep gains in check. Additionally, the ratio remains under the red resistance zone marked on the very short-term chart below.
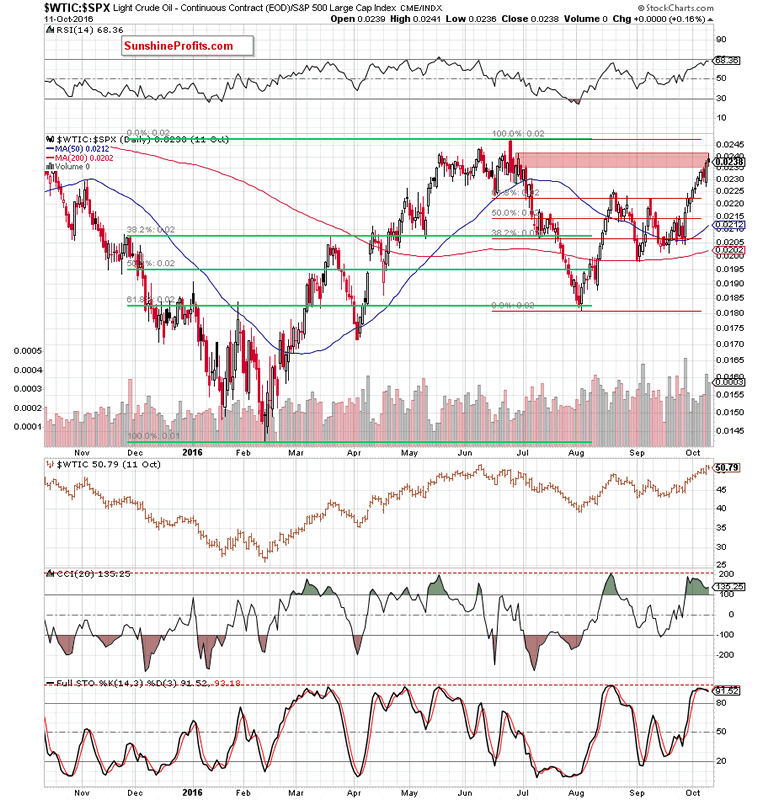
From the daily perspective, we also see that (similarly to what we wrote in case of the oil-to-gold ratio) there are negative divergences between indicators and the ratio, which do not bode well further rally. On top of that, the Stochastic Oscillator generated a sell signal, which would become even more bearish if drops below the level of 80 in the coming days.
Summing up, the oil-to-gold and oil-to-stocks ratios extended gains in recent weeks, climbing to the key resistance zones, which suggest that reversals are just around the corner. Additionally, the current position of the daily indicators (negative divergences and sell signals generated by the Stochastic Oscillators) doesn’t bode well for further rallies. What does it mean for crude oil? Taking into account the fact that strong positive correlation between both ratios and crude oil remain in play, we think that lower values of both ratios will translate into lower prices of light crude (similarly to what we saw many times in the past) in the coming days.
If you would like to know more about oil market and our interesting ratios, we encourage you to sign up for Oil Investment Update, Oil Trading Alerts or the All-Inclusive Package that includes them.
Thank you.
Nadia Simmons
Forex & Oil Trading Strategist
Sunshine Profits: Gold & Silver, Forex, Bitcoin, Crude Oil & Stocks
Stay updated: sign up for our free mailing list today
* * * * *
Disclaimer
All essays, research and information found above represent analyses and opinions of Nadia Simmons and Sunshine Profits' associates only. As such, it may prove wrong and be a subject to change without notice. Opinions and analyses were based on data available to authors of respective essays at the time of writing. Although the information provided above is based on careful research and sources that are believed to be accurate, Nadia Simmons and his associates do not guarantee the accuracy or thoroughness of the data or information reported. The opinions published above are neither an offer nor a recommendation to purchase or sell any securities. Nadia Simmons is not a Registered Securities Advisor. By reading Nadia Simmons’ reports you fully agree that he will not be held responsible or liable for any decisions you make regarding any information provided in these reports. Investing, trading and speculation in any financial markets may involve high risk of loss. Nadia Simmons, Sunshine Profits' employees and affiliates as well as members of their families may have a short or long position in any securities, including those mentioned in any of the reports or essays, and may make additional purchases and/or sales of those securities without notice.
© 2005-2022 http://www.MarketOracle.co.uk - The Market Oracle is a FREE Daily Financial Markets Analysis & Forecasting online publication.