


Large Sell-off in Stock Market Looming
Stock-Markets / Stock Markets 2016 Oct 24, 2016 - 12:35 PM GMTBy: Brad_Gudgeon

 About every 20 weeks or so there is usually a noticeable sell-off in the stock market. We had the October 15, 2014 low followed 20 weeks later, in mid March, 2015 by a low, which was followed in late August (the 24th) by that low. Then roughly 5 months later on January 20, 2016 by a low, then June 27th and now November 2016. The March 2015 low was a shallow, skipping low as was June 27, 2016 (the Brexit low).
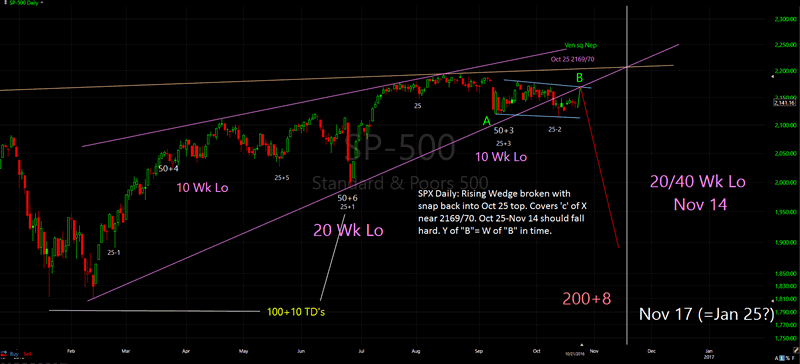
November 2016 also represents the 8-year cycle low due from November 21, 2008. Wednesday next week is exactly 40 weeks from the January 2016 low, so it is due. The 20 week lows are subdivided by 5 and 10 week lows last seen 8/2/16(five), 9/12/16(ten) and 10/13/16(five). The ideal 10/20/40 week low is due Nov 21, 2016 one week.
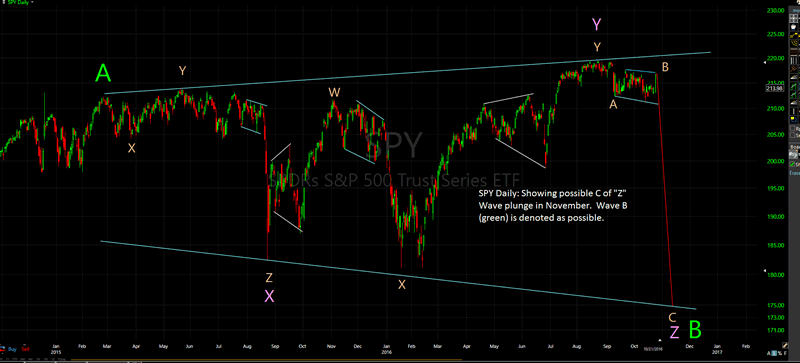
The e-wave notations on the SPY chart suggest a bearish inverted WXY "Y" wave with a "Z" wave to come. The "Z" wave subdivides ABC. We are almost through with Wave B (wave y of B, October 25th near 2169?) and as you can see on the SPX chart below it is snapping back to the large Rising Wedge pattern. Waves w and y of B look to be equal in time (a rally of 8 trading days), which fits the Equality of Waves Principle.
Astro-wise we have the Mars translation (October 19-29) of the Uranus/Pluto square with Mars squaring Uranus on October 28/29. Mars also translates the U.S Stock Market chart from October 22 through November 4th. Mars is the ruler over war and terrorist activity. Venus square Neptune (oil) on October 25th seems to coincide with the expected stock market top on Tuesday.
There are a series of trines due October 30, November 1 and November 5th. These usually represent tops or points of exhaustion. I believe that Wave "c" of "Z" will likely subdivide into 5 waves down, with Wave 1 October 25-28, Wave 2 October 31, Wave 3 October-November 4th and Wave 4 November 7/8 down into November 14 completing Wave 5.
Bradley turns are due 11/3(lo), 11/15(lo), 11/25(hi), 11/29(lo). TLC low turns are due 10/28, 11/4, 11/14, 11/17 and 11/29. I'm drawing a parallel to Dec 29, 2015-January 20, 2016 and then into February 11, 2016 (Dec 7th, 2016?).
My translation of all this suggests to me that the first wave down will likely be a shallow one (based on the tightness of the Bollinger Bands), breaking slightly below the 2114 recent low by the end of the month and rallying marginally into October 31. I don't know the cause here, but suspect war tensions (Mars) with Russia over Syria and the election (or related news) along with technical problems with the expected rally.
War tensions should increase in early November as Russian ships enter into the Mediterranean Sea closing in on the east (Wave 3 down much harder than Wave 1). Wave 4 rallies into (11/07) or near election-day. Wave 5 is the panic wave, panic over the Russians and the election outcome (I assume?). The SPX could end up well into the mid to upper 1700's (mid 1600's maximum) by or around November 14.
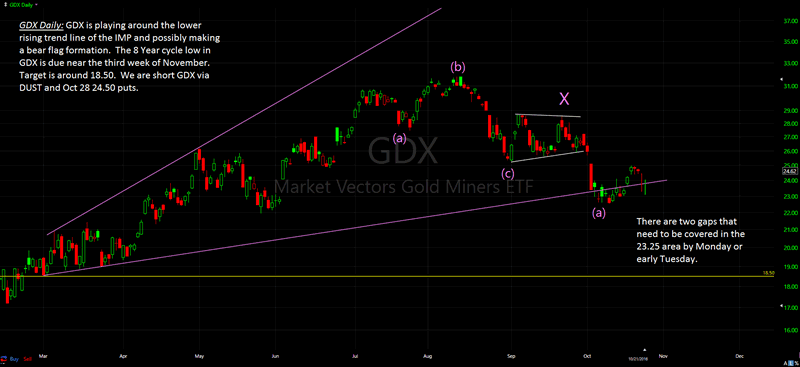
I have GDX down around 18.50 due to the IMP shown by mid November. I have shown this IMP before and also time begs me to submit this article in a timely matter, so I'm not going over it this time around.
The longer term patterns and cycles are still up in the stock market, but time is running out before the stock market does a 1929-32 type of move. It is coming sooner than many think, just a couple of short years away, even less (along with it, the start of WWIII, I'm afraid). I will be writing more about this after the election.
There has been much written about the 4-generation 20-22 year cycles (totaling 80-88 years) in the Fourth Turning. The year 2016 represents the 240 year cycle from 1776. Not only are we facing the specter of a war overseas to fight militant Islam, but a New American Revolution to fight the new Tories in power, all at the same time.
SPX Daily Chart
SPY Daily Chart
GDX Daily Chart
I'm trying to help as many people as I can make money during this coming crisis. It is during times of turmoil like the one I expect in the next 3-4 weeks that traders can make the most money.
We are short GDX via DUST and October 28 24.50 put options. We look to go long via SPY call options on Monday if the market allows for the expected rally Tuesday. We are already long volatility via SVXY at 71 (now near 77) and SPXL.
Like a weather forecast, I have has to adjust my strategies as I go. Day by day, I receive new data and day by day those strategies may change. Keep this in mind when reading this article.
We now offer free auto trading. BluStar subscribers now have access to free auto trading via Auto Shares.
Brad Gudgeon
Editor of The BluStar Market Timer
The BluStar Market Timer was rated #1 in the world by Timer Trac in 2014, competing with over 1600 market timers. This occurred despite what the author considered a very difficult year for him. Brad Gudgeon, editor and author of the BluStar Market Timer, is a market veteran of over 30 years. The website is www.blustarmarkettimer.info To view the details more clearly, you may visit our free chart look at www.blustarcharts.weebly.com.
Copyright 2016, BluStar Market Timer. All rights reserved.
Disclaimer: The above information is not intended as investment advice. Market timers can and do make mistakes. The above analysis is believed to be reliable, but we cannot be responsible for losses should they occur as a result of using this information. This article is intended for educational purposes only. Past performance is never a guarantee of future performance.
Brad Gudgeon Archive |
© 2005-2022 http://www.MarketOracle.co.uk - The Market Oracle is a FREE Daily Financial Markets Analysis & Forecasting online publication.