


Gold, HUI and the Banking Crisis
Stock-Markets / Financial Markets Aug 03, 2008 - 03:14 PM GMTBy: John_Needham

 Traditionally Gold has been used as a hedge when times become tough, in his latest article, John Needham, explores the critical market turning points for Gold and and its relationship to the Dollar Index. He also looks at what may be in store for the FTSE index. - Yvonne Lundon-Marchant - The Daniel Code U.K. and Europe
Gold and its D2, HUI
The Gold bugs' arguments in favour of the precious metal are always based on the mantra that Gold is money and because of its limited availability will always be a hedge in times of trouble and a hedge against inflation. If that were true, the same arguments should apply to Silver. Indeed the case for Silver should be more compelling. It has a greater historical use as money and it has several important industrial applications that continually remove product from the available stockpiles.
Our emotional, almost visceral attraction to these precious metals which are inextricably linked with mankind's history remains unabated in most, but traders need to do more than slavishly cling to a buy and hold policy and investors need a clear understanding of market forces to time their entry or re-entry into these markets. The unavoidable truth of precious metals markets is that they have also taken on some of the characteristics of tradeable commodities and as such the liquidity wave which we have seen in almost all other commodities has created a premium in these markets too.
For Gold, one of its historic attractions has been as a hedge against the world's reserve currency, the US Dollar. We can measure that premium quite simply by recognising the price action in Gold as the carry trade unwound in the 5 days following the DX (US Dollar Index) bottoming on 17 th March. That was the smart money, those few who knew that a reversal in DX near 70.40 would likely mark at least an intermediate low for the Dollar. Strange as this may seem to many of you who are not familiar with the power of the Daniel sequence numbers, 70.40 was forecast to be at least an intermediate low in the Dollar six weeks before it happened in an article I published to clients in mid February.
For the cognoscenti, who knew the Daniel sequence about to unleash its mandated support, the capitulation of DX from 11 March marked the final dive to 70.70 where mysteriously in the secret way of markets, massive support materialised just 30 ticks above the long term Daniel sequence target. As those Dollar-Gold hedge positions were closed out, Gold gave up $128 from its 1033.90 high in the same 5 days. You can see the initial plunge on the following chart:
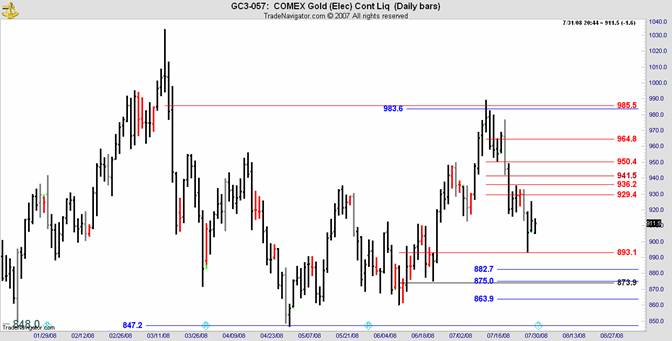
After the initial plunge, the subsequent price action forced those who did not know that a bottom was in for DX to unwind their hedges at much lower prices, but from the Gnostics we can impute a liquidity premium of almost $120. That is the task now for Gold to overcome.
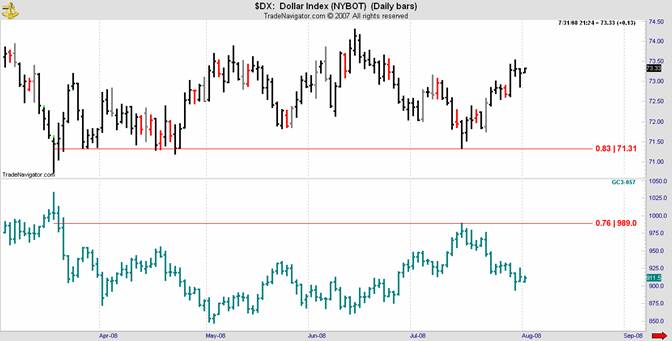
Since the unwinding of the big institutional carry trades, Gold has slavishly followed the inverse price movements of DX practically on a daily basis. DX up: Gold down.
We see the nexus between these markets in the following chart where DX low from the June rally was made at an 83% retracement whilst the Gold rally made 76% to the old top.
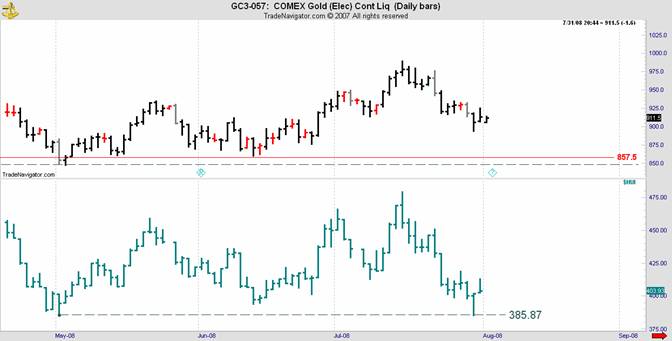
Many Gold traders use D2 or derived data to bolster their analysis. In the same way that we will look for a longer term chart to confirm signals on the shorter term chart, D2 data is price action from another related market that tends to confirm or deny the validity of a signal in the primary market. For Gold, the most important derived data comes from its cousin Silver and the HUI index. HUI is an index of thirteen major Gold mining stocks that do not hedge their Gold production in forward markets, hence their stock price is primarily sensitive to rises and falls in market prices for Gold. The logic is that if Gold is in demand (demand exceeds supply), the market will bid up prices for these Gold producers and hence the HUI index will rise. Many see this play as a vital confirming signal for the primary market, Gold.
The following chart composite shows Comex Gold in the top sector and HUI index in the lower.
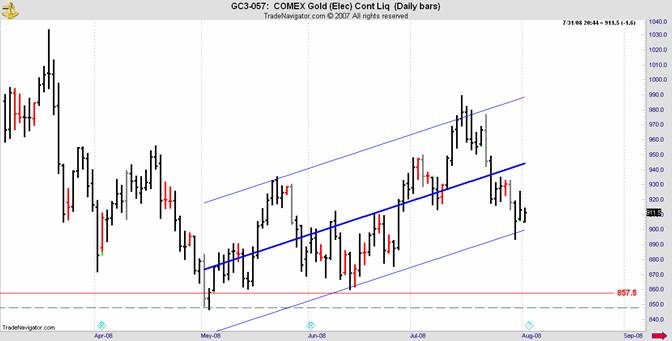
Whilst Gold is trading at the bottom of its regression channel from the April lows, it is still comfortably ensconced within the larger trading range. Note the proclivity of Comex Gold to follow the normal regression channel. This one is two standard deviations.
By contrast HUI tested its May lows this week and the two day rally that ensued looks destined to fail. Whether and when HUI breaks its low for the year is still before us, but the minimum conclusion we draw is that any buy signal in Gold cannot be confirmed by HUI in its current position. In fact HUI is presently on a long term sell signal from the monthly chart, a position that it has slavishly maintained since the March high. A monthly close above 461.10 is required to negate the present sell signal and that appears a remote possibility right now. The chart below is an unusual DC binomial version of HUI monthly.
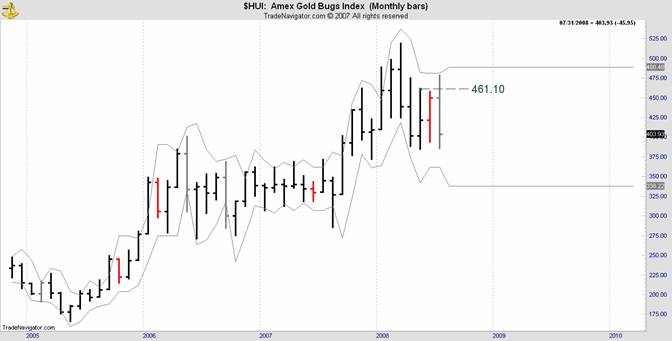
It is undoubtedly fair to observe that there are factors other than the price of the physical that may be affecting the price of HUI stocks. The withdrawal of liquidity caused by the banking credit crisis and the rationing of commercial credit to corporates likely is a factor. Miners are by nature money hungry beasts as the never ending demands to build infrastructure must be funded.
Gold miners in particular have a dreadful record of cost overruns and an intrinsic liability to inflationary input costs of which there are many. OECD governments' devotion to softening the blows of the housing rout and America's particular vulnerability to poor economic news in a crucial election year which for constitutionalists is poised to deliver all three arms of government to the Democratic hordes, means that on that side of the Atlantic we will continue to see policy settings that will merely prolong the inevitable.
For many, the question is “When does the economy/housing market/consumer confidence bottom, and things return to normal.” The implication being that economic events of the past decade and in particular the past 5 years were somehow “normal” and when the present storm blows over, the status quo will resume. That's not going to happen folks. The credit and lending spree and resultant absurd asset appreciation that we have seen is the tumor. Once it has been excised it is not coming back for a generation. As those bankers who still have a job are concentrating on repricing risk to realistic levels, they are being thwarted at every turn by central banks hell bent on softening the fallout from the housing debacle. Faced with the inability to price risk correctly, credit rationing is occurring, and miners, I suspect are far from the most desirable borrowers in this environment.
FTSE
The FTSE and DAX indices as representative of market sentiment this side of the Atlantic have much to tell us. Both are defined by the Daniel number sequence, as are all markets. The recent leg of the run down from the July 2007 high stopped right at its Daniel number of 5078 (July low 5071) and is rallying into the standard DC retracement ratios shown on the FTSE chart. Market turns often occur at important anniversaries although those that are apparent on the Gregorian calendar are mere happenstance designed to cement the belief of cycle analysts that this is how markets work. In fact although Gregorian calendar anniversaries occasionally occur they are a mere byproduct of the real cycles that dominate all life including markets which at their essence are reflections of human fears and hopes.
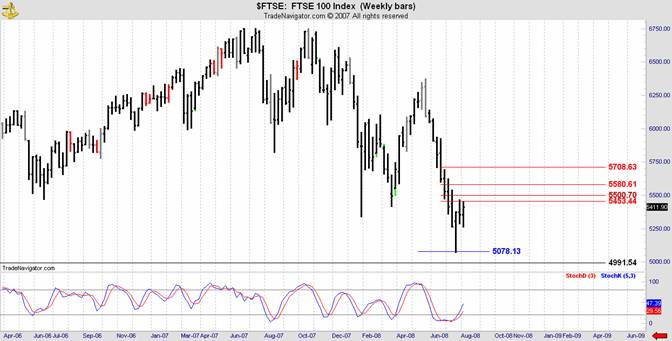
At present an optimistic chartist would argue that the whole of the move down is overlapping and therefore corrective. On that basis happy days will be here again soon! It's not going to happen. The important number on this chart is 4991. That is the last level of Danielcode support for the major swing starting from April 2005. A weekly close below this number portends much lower numbers for FTSE, a condition more in keeping with the economic woes that far from nearing the end are at best somewhere near the middle of the cycle, with housing likely to revert to mean over a period of not less than seven years. Once at the mean, the default setting is not ballooning again as property pundits expect, but merely hugging the mean. That means an “L” shaped price chart in housing for years to come.
The extraordinary events whereby housing and illusory house price wealth became the dominant driver of the most rampant bout of consumerism in our history will be many years in the unfolding. Housing cycles are long and slow. Governments in the western world are slowly appreciating what a belief bedrock housing wealth has become and are laboriously intent on turning back the waves of reality that are starting to flow.
Economists, by which central banks and government fiscal policy are dominated, generally lack a classical education accustomed as they are to the intricate arts of navel gazing and divination from chicken gizzards, so they are unaware that all this has been tried before.
 Canute the Great, Viking warrior and conqueror of England in 1016 at the Battle of Ashingdon, went onto be ranked among the wisest of England 's rulers. School children used to know (but probably don't in the current generation) that King Canute demonstrated the limits of man's power when he facetiously commanded the tide to stop rising as he sat on the sea shore. Wet feet will be the least of the problems for policy makers who think they can do what Canute couldn't. The tide will not be denied.
Unlike US where the twin triggers of adjustable rate mortgages (ARMs) and non recourse mortgage agreements have combined to trigger a tidal wave of foreclosures, the relatively more conservative structuring of UK and European housing loans will make the great devaluing here, a slow and tedious affair lacking the drama and immediacy of US property markets, but the waves are rolling with great surety as the engine of asset normalisation comes back to life after its long hibernation.
I invite you to visit the Danielcode Online to learn more about markets and the Daniel numbers that define them.
By John Needham, The Daniel Code Report | 3 August 2008
See http://www.thedanielcode.co.uk for the full article and for more information about DC Numbers including a free two week trial .
John Needham is a Sydney Lawyer and Financial Consultant. He publishes The Danielcode Report and writes occasionally on other markets. He lives with his family in Australia and New Zealand .
John Needham Archive |
© 2005-2022 http://www.MarketOracle.co.uk - The Market Oracle is a FREE Daily Financial Markets Analysis & Forecasting online publication.