


Stock Market Saeculum 1st Turning Underway
Stock-Markets / Stock Markets 2016 Dec 10, 2016 - 11:51 AM GMTBy: Tony_Caldaro

 The market started the week at SPX 2192. After a gap up opening on Monday the SPX rallied to 2252 by Thursday. Then the largest pullback in a week took the SPX down to 2243 late Thursday, before the market rallied and closed at a SPX 2260 all time high on Friday. For the week the SPX/DOW gained 3.10%, and the NDX/NAZ gained 3.35%. Economic reports for the week were light and leaned positive. On the downtick: consumer credit, wholesale inventories, the Q4 GDP estimate, plus the trade deficit increased. On the uptick: ISM services, factory orders, consumer sentiment, the WLEI and weekly jobless claims improved. Next week’s reports will be highlighted by the FOMC, retail sales and industrial production. Best to your week!
THE FOURTH TURNING
There has been some mention of the 4th turning in the media lately and rightfully so. Not because we are still in the midst of the turning, as reported, but that it is coming to an end. We have written about the Saeculum, which is a four generational master cycle that consists of four turnings or secular cycles, (a word derived from the Saeculum), in past posts: https://caldaro.wordpress.com/2010/11/04/politics-and-secular-bullbear-markets/ and https://caldaro.wordpress.com/2010/02/14/grand-super-cycle-revisited%e2%80%8f/. I had studied this theory over twenty years ago, taking it back 6,000 years in history, and found it to be quite compelling. Since then it was integrated into our OEW analysis.
The Saeculum, which was discovered by the Sybil about 3,000 years ago, is a repetitive four generation cycle that unfolds because each generation raises their children in a predictable cyclical manner. Each Saeculum cycle consists of four turnings, secular cycles, that each last about 15-20 years, creating the larger 70-80 year Saeculum cycle. The four secular cycles that create one Saeculum cycle are called: growth, protest, unraveling and crisis. Each of the secular cycles have their own economic/political characteristics. You can get more information about these secular cycles using the links above.
In economic/political terms a full Saeculum cycle unfolds like this. After a Crisis ends there is a generation of secular Growth: strong economic growth, low inflation, low commodity prices, low interests rates, and a strong secular bull market in equities. Protest: economic growth stagnates, inflation rises and peaks, a commodity bull market, interest rates rise and peak, and equities crash and then enter a trading range. Unraveling: economic growth picks up again, inflation declines, commodities enter a bear market, interest rates decline, and there is a strong bull market in equities. Crisis: economic growth crashes then recovers, low inflation even deflation, a commodity bull market, interest rates decline and bottom, and equities crash and then enter a trading range.
To summarize in investment terms. The two best secular cycles to own equities are Growth and the Unraveling. The two best secular cycles to own commodities are the Protest and Crisis cycles. Interest rates rise during the Growth and Protest cycles, and decline during the Unraveling and Crisis cycles. Therefore it is important to know what secular cycle is underway and when it is ending. Since there is some confusion in the media, and even by one of the book’s authors, we will try to clear this up. We have had the luxury of observing a complete Saeculum cycle, as it relates to the stock market and other asset classes over the past century. There is a chart in one of the links above.
The Unraveling cycle (1908-1929), which created the FED, government regulatory intervention, taxation, and consumer credit, ended with a speculative blow off top in equities in 1929. The 1929 stock market crash was the trigger for the Crisis cycle (1929-1949) that followed, and it was confirmed by the election of Roosevelt (1932). The Growth cycle (1949-1966) was triggered by the Marshal Plan (1948), the rebuilding of Europe after WW II, and confirmed by the election of Eisenhower (1952). The Protest cycle (1966-1982) that followed was triggered by the deployment of US combat troops into Viet Nam (1965) and confirmed by the election of Nixon (1968). The Unraveling cycle (1982-2000) was triggered by the FED raising rates to historical levels (1980) to end an inflationary spiral, confirmed by the election of Reagan (1980), and ended with a speculative blow off top in equities. The Crisis cycle (2000-2016) was triggered by the election of GW Bush (2000) and confirmed by the tragic 911. Pearl Harbor, during the previous Crisis cycle, lost about 3,000 Americans, nearly the same number as 911. The Growth cycle, we believe just started, was triggered by the nationalistic/populist movement across the world (2016), it will spread, and confirmed by the election of Trump (2016). Sounds far fetched? Let’s take a different view.
Nearing the end of the last Crisis cycle (1929-1949) the US, and much of the western world for that matter, embraced Keynesian economics. The economic system that suggests government should intervene when the economy weakens and aim for full employment which will fuel the economy. This worked quite well for the Growth cycle (1949-1966). However, after a period strong economic growth, an over-confident political class, a wealthy middle class, and a tight labor market, excesses appeared and political mistakes were made. The Protest cycle (1966-1982) was then underway. As the economy spiraled out of control a new economic theory was forming: Laffer economics, better known as supply-side trickle down economics. The economic system that suggests corporate growth should fuel the economy, and their gains will trickle down to the masses. The Unraveling cycle (1982-2000) began with the election of Reagan (1980) and the implementation of this economic system. This worked well until an over-confident political class took corporate growth to an extreme, and many, many mistakes were made. The Crisis cycle (2000-2016) was then underway. A dotcom bubble imploded, 9/11, a real estate bubble imploded, the near extinction of the middle class, the worse bear market in equities since 1929-1932, the growth in the one-percent class, tax inversions, and more. Just like during the Protest cycle when Keynesian economics created excesses and failed, Laffer economics eventually created excess and failed as well. As this was unfolding a new economic theory was forming. Let’s call it renewed Keynesian economics for now. Instead of using the economy to build international corporations in supply side economics, let’s use corporations to rebuild the middle class and they will grow the economy. The cycle of nationalism (growth/protest) to internationalism (unraveling/crisis) is returning back to nationalism (growth/protest). And the transition is underway now!
LONG TERM: uptrend
The Primary III bull market that began in February 2016 continues to make new all time highs in most of the major indices. We do not believe this advance from February is a fifth wave, as it did not quantify as a fifth wave using OEW. In conventional Elliott Wave technicians can place labels anywhere they have what appears to be the right look. In OEW we can only place labels at the beginning and end of mathematically quantified waves. This has been the case since the early 1980’s, and it has worked quite well.
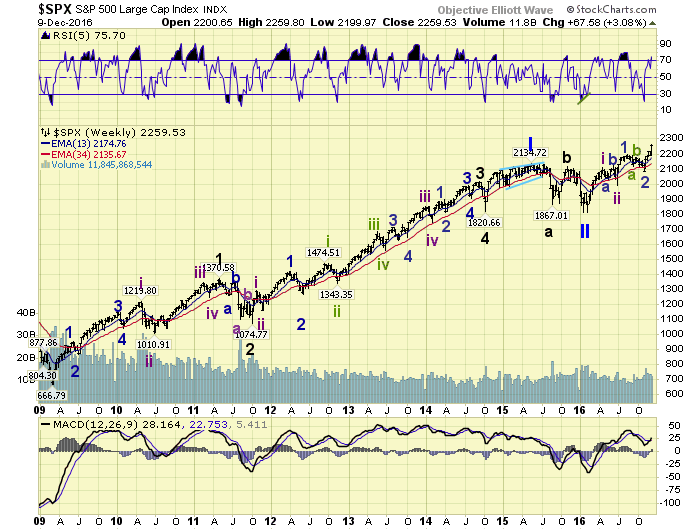
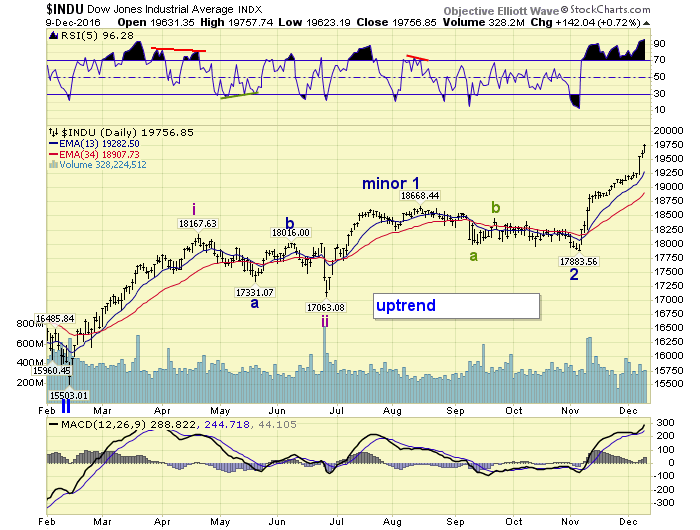
From the February Primary II bear market low the market is now in its third impulsive uptrend. As noted on the above/below charts the first uptrend was labeled Intermediate wave i, the second uptrend Minor wave 1 of Int. wave iii, and the current third uptrend Minor wave 3 of Int. iii. The strength in the DOW, and its acceleration to the upside is typical of third wave activity.
MEDIUM TERM: uptrend
From the Minor wave 2 downtrend low in early November at SPX 2084 we have labeled a Minute wave i to SPX 2214, a Minute wave ii at SPX 2187, with a Minute wave iii currently underway. Since this uptrend is a third wave, and not a first, we are expecting it to advance more than Minor 1 (202 pts.) and similar to Int. i (301 pts.). This would give this uptrend a potential target in the SPX 2380’s some time in January. Thus far the uptrend is five weeks old and has travelled 176 points. So it appears right on track with possibly seven weeks to go.
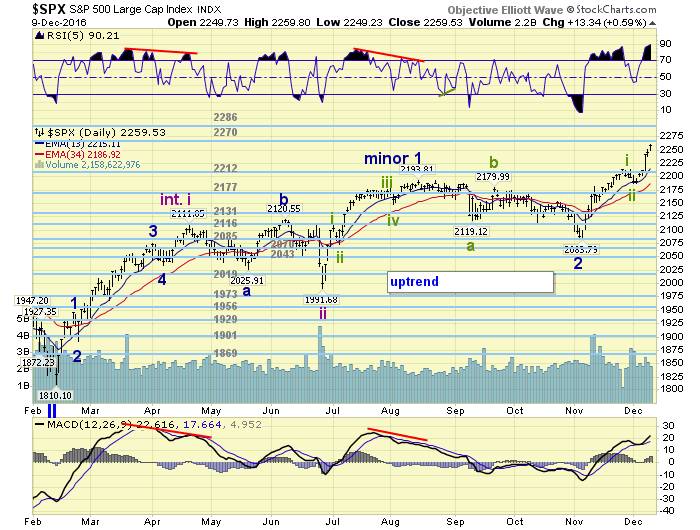
Once the uptrend concludes we would expect a sharp correction of about 100+ SPX points for Minor wave 4, then another uptrend to new highs for Minor 5. But all this activity would only complete Intermediate wave iii of Major wave 1. Primary waves consist of five Major waves. Therefore, thinking about a bear market anytime soon would be premature. Medium term support is at the 2212 and 2177 pivots, with resistance at the 2270 and 2286 pivots.
SHORT TERM
Minute wave i off the Minor 2 downtrend low at SPX 2084 was quite somewhat difficult to count, but topped at the OEW 2212 pivot. The wave kept subdividing into smaller and smaller waves, an impulsive 27 in all. Minute wave ii was quite simple, bottomed at the OEW 2185 pivot, and then Minute wave iii took off to the upside. Once the OEW 2212 pivot range was cleared on Wednesday the rally accelerated.
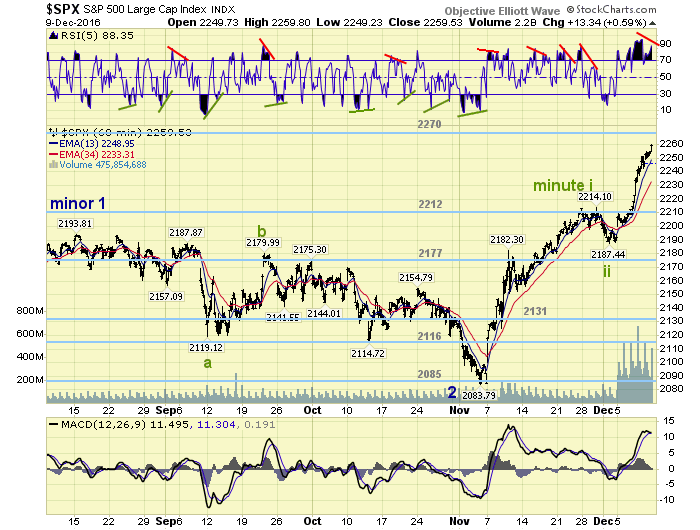
The next upside target is the OEW 2270 pivot, and then the OEW 2286 pivot. The market closed on Friday within 3 points of the OEW 2270 pivot range. These two pivots should offer some resistance, but it is unlikely that Minute iii will end there. The target range for Minute iii is between SPX 2288 and 2368. Thus far this bull market’s characteristics have been quite consistent. Short term support is at the 2212 and 2177 pivots with resistance at the 2270 and 2286 pivots. Short term momentum ended the week with a significant negative divergence, but no pullback yet to even consider it. Best to your trading!
FOREIGN MARKETS
Asian markets were mostly higher and gained 1.5% on the week.
European markets were all higher and soared 5.5% on the week.
The DJ World index gained 2.9% on the week.
COMMODITIES
Bonds continue to downtrend and lost 0.4% on the week.
Crude is in an uptrend but lost 0.4% on the week.
Gold remains in a downtrend and lost 1.4% on the week.
The USD is still in an uptrend and gained 0.6% on the week.
NEXT WEEK
Monday: budget deficit at 2pm. Tuesday: export/import prices. Wednesday: retail sales, the PPI, industrial production, business inventories and the FOMC meeting concludes. Thursday: the CPI, weekly jobless claims, the Philly/NY FED, and the NAHB index. Friday: housing starts and building permits.
CHARTS: http://stockcharts.com/public/1269446/tenpp
After about 40 years of investing in the markets one learns that the markets are constantly changing, not only in price, but in what drives the markets. In the 1960s, the Nifty Fifty were the leaders of the stock market. In the 1970s, stock selection using Technical Analysis was important, as the market stayed with a trading range for the entire decade. In the 1980s, the market finally broke out of it doldrums, as the DOW broke through 1100 in 1982, and launched the greatest bull market on record.
Sharing is an important aspect of a life. Over 100 people have joined our group, from all walks of life, covering twenty three countries across the globe. It's been the most fun I have ever had in the market. Sharing uncommon knowledge, with investors. In hope of aiding them in finding their financial independence.
Copyright © 2016 Tony Caldaro - All Rights Reserved Disclaimer: The above is a matter of opinion provided for general information purposes only and is not intended as investment advice. Information and analysis above are derived from sources and utilising methods believed to be reliable, but we cannot accept responsibility for any losses you may incur as a result of this analysis. Individuals should consult with their personal financial advisors.
Tony Caldaro Archive |
© 2005-2022 http://www.MarketOracle.co.uk - The Market Oracle is a FREE Daily Financial Markets Analysis & Forecasting online publication.