


Gold and the Economy: Facts and Theories
Commodities / Gold & Silver Aug 17, 2008 - 09:31 AM GMTBy: Brian_Bloom

 When we understand “what” is happening (the facts) then we might have a stab at “why” it is happening (the theories). In turn, this might throw some light on what we might expect to unfold in the foreseeable future.
We live in a cynical world and from a cynical perspective it is noteworthy that all I am reading with regard to the gold price is theories.
Let's take a close look at some facts:
The first fact of significance can be found on the weekly chart below (courtesy decisionpoint.com )
The reader will note the existence of two gaps in this chart. When a gap manifests on a bar chart it is a sign of a highly charged emotional market. There's no logical reason why the price of gold should open on a Monday at a lower price than it closed on a Friday. Some are arguing that these gaps are being “forced” by intervention and/or price manipulation by vested interests. The facts would suggest otherwise. What is happening is within the bounds of normal technical behaviour of markets.
The first gap above is generally referred to as a breakaway gap, and the second (which can be used for measuring purposes to estimate short term destination) is called a runaway gap. The midpoint between the two gaps is the targeted minimum move. The midpoint of the breakaway gap is 900 and the midpoint of the runaway gap is at approximately $850. The targeted minimum move from the top of the runaway gap at around $825 is thus:
$825 - ($900 – $850) = $775.
It happens that $775 lies precisely on the support level of the rising trend line.
Will the support hold?
Let's look at some other facts.
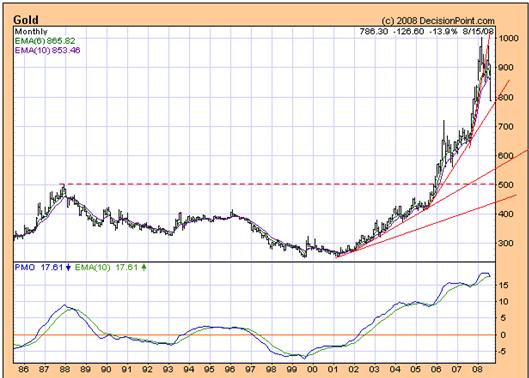
An important fact embedded in the above monthly chart is that the PMO Oscillator is in rarefied territory and has just turned down. If the blue line crosses the green line then the traders would call this a “sell” signal. However, it is also a fact that the blue line crossed over the green line twice since 2005, and the price continued to rise. Also significant is that at a level of 15, the PMO is unlikely to go higher at this point. If the $775 level holds and the price holds at around that level then the PMO could pull back for a relatively short period for the sole reason that the PMO is a ratio of prices at different points in time.
Unfortunately, that still leaves us unsure of whether the $775 level will hold.
The chart below of the weekly goldollar index (courtesy Decisionpoint.com) shows how close we are to a decision regarding whether or not we are facing a structural change in the markets.
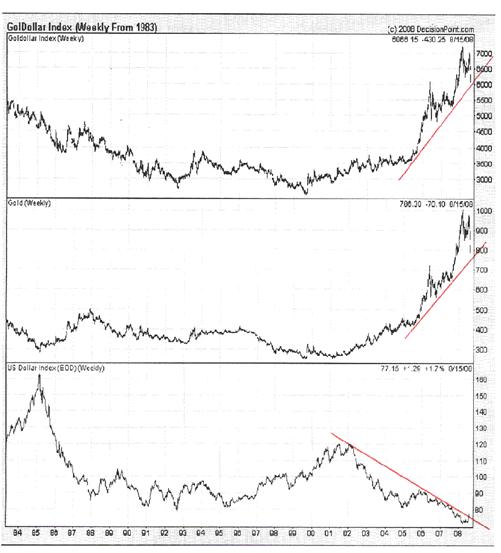
The reader will note that whilst the middle chart of the weekly gold price is above its rising red trend line – which is the same line that provides “support” at $775, the weekly goldollar index is closer to its rising trend line. The primary reason for this is that the US Dollar chart appears to be peeking through the falling trend line. Will the dollar break up? If it does break up, the goldollar index may very well break down.
Why would the goldollar index break down?
One should remember that the goldollar index is derived by multiplying the gold price by the dollar index. This line should not be rising at all if the dollar and gold did indeed move inversely. It should be a horizontal line. Therefore, the reason the goldollar index chart has been rising is that the gold price has been rising faster than the dollar has been falling. If the dollar starts to rise from these levels then that would represent a structural change in the markets and the gold price will likely break strongly below its rising trend line. It is nail biting time for gold “investors”.
At this point it is probably appropriate to quote from an article that I wrote on July 19 th , 2008 , when the gold price was $954 an ounce: “Are we traders in gold or are we investors in gold? If we are traders, the charts are pointing to a “possible” 50% rise in the US$:$Gold ratio, and a “possible” 18% fall in the $HUI relative to a (falling?) gold price.”
On that day, the ratio of the US Dollar Index to the Gold price was .07537. As at close of business on Friday, August 15 th , the ratio was .09739. A 50% rise from .07537 would take it to .113055. Will it get there? The evidence is mounting that it might.
In an article that I wrote on August 5th , when the gold price was $894.90, I made the following observation:
“It is clear … that the $850 an ounce level is very important. If the gold price falls below that level then the previous up-move may turn out to be a ‘false' move, and the price could come all the way back to around $700 an ounce.”
The time has come for us to face one more fact, and that fact is that there has been a formation emerging on the weekly gold chart which might be described as a Head and Shoulders Top – as can be seen below:
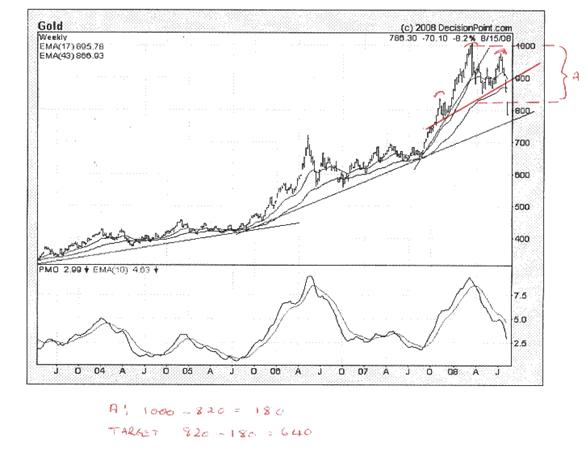
If this formation is indeed a Head and Shoulders Top (which couldn't possibly have arisen as a result of market manipulation by vested interests) then it becomes important to focus on the fact that the distance between the head and the neckline, as depicted by the horn bracket marked “A”, is $180.
Typically, if a H&S neckline is penetrated on the downside – which happened when the breakaway gap manifested at the $900 level - then the target destination level would be the distance between the top of the head and the neckline immediately below it. i.e. The target move of the gold price would be $180 from the neckline at that point. Therefore, the target destination price is:
$840 - $180 = $640 an ounce.
This is probably why the first gap manifested. Penetration of the $900 support level was critically important because it signalled a breakdown from a Head and Shoulders formation.
Also of great significance, the second gap manifested at exactly the $840 level (as shown by the horizontal dashed line), thereby confirming that the formation was indeed a Head and Shoulders reversal formation. Again, this is very likely why the second gap manifested.
It follows from the above that those analysts who are arguing “manipulation” are probably talking to their books. The facts show that the gold market is behaving perfectly in accordance with technical expectations. In fact, the perfection is so exquisite that it might even be described as “textbook” behaviour. With this degree of compliance, I would not be surprised to see the rising black trend line penetrated on the downside with another runaway gap, although the reader should understand that I am not making this call. I am merely describing possible price behaviour that would be within the bounds of natural market behaviour without any external intervention being necessary.
That gold is not the only commodity that is pulling back from its dizzy heights is evidenced by the following commodities chart, courtesy Decisionpoint.com. Note how the index is now sitting below it 43 week Moving Average and that the MA is turning down. This is not a bullish chart in the short term, but the trend-line at the 450 level is rising.
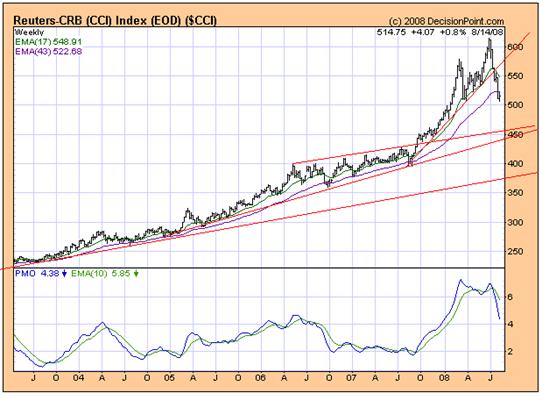
The objective fact is that commodities in general, whilst weak, are still in a Primary Bull market.
+++++++++++++
Now let's turn our attention to theory. Why is this near term weakness in gold and commodities manifesting and what could it mean?
The first thing we should focus on is that the $640 and ounce price target for gold – should it materialise – will also still be above the second rising trend line on the monthly chart in the second chart in this article. This would imply that the Primary Bull Market in gold will also likely remain intact, and that the markets are now merely heaving a sigh of relief.
Why? What could possibly justify a sigh of relief? We still have a massive debt overhang and we still have a massive counterparty risk in the derivatives' markets which some are arguing are approaching the quadrillion dollar level; and we still have peak oil with no substitute for fossil fuels in sight and we still have climate change.
Aaah! But when the going gets tough, the tough get going; and the evidence suggests that the tough have at last started to act. The evidence also suggests that the world is starting to come to its senses. What is this evidence?
- As I suggested in my recently published factional novel, Beyond Neanderthal , the macro problems relating to peak oil cannot be solved by profit oriented Private Enterprise because Returns on Investment will be inadequate in the early days. Therefore, Central Governments would be well advised to take directly supportive interventional action. This is now happening in the USA, as was reported in an article entitled “US Military launches war on Global Warming” which can be found in the New Scientist at http://environment. newscientist.com/channel/ . It was reported in this article that “Pentagon officials say their green energy efforts will help America fight global warming.” This statement represents classical disinformation. What the Pentagon will in fact be doing will be related to pursuing alternative sources of energy to fossil fuels in response to Peak Oil and environmental pollution. (Sigh of relief.)
The pessimists, of course, will be worrying about the US moving towards Marshall Law or some equally draconian interpretation – which is probably why the media disinformation was skewed towards emphasising Climate Change, which “everybody” recognises is the common enemy.
However, to ensure a successful outcome (of searching for viable alternatives to fossil fuels), the appropriate attitude of Central Governments would be equally well advised to be more supportive than dictatorial; and one conceptual approach is outlined in my novel which is may be purchased from www.beyondneanderthal.com
- The “fear” regarding climate change is starting to recede (sigh of relief) as experts in their field begin to speak out regarding the lack of mathematical proof of a cause-and-effect linkage between CO2 and Global Warming. Of course , CO2 levels in the atmosphere have been rising! Of course , ambient temperatures have been rising! But these two simultaneously manifesting facts do not prove that one caused the other. The climate expert to come out against this concept most recently was Dr Roy Spencer, previously of NASA, who confirmed in testimony before the US Senate on July 22nd 2008 that the importance of cloud formation had been underestimated. You can read his testimony at http://epw.senate.gov/public/ index.cfm. Unfortunately, as is explained in my novel, a sigh of relief in this regard would be misplaced, because “something” must have been causing the global warming and, if that something was our sun then this will have other equally serious implications given that our sun may be approaching a period where it quietens down. Hopefully, the Pentagon will be taking this into account and will be planning to encourage a shift from centralised energy production to localised energy production.
- There is a dawning understanding that the world of international finance is a zero-sum game. The combined value of the deficits of all the world's negative trade balances exactly equals the combined value of the surpluses of all the world's positive trade balances. This doesn't mean that the world's economy is healthy, but it does mean that the parlous state of the US economy is not necessarily being reflected in economies like China, India and the Oil exporting Nations. These nations, in combination, are sitting on currency reserves of over $5 trillion, which reserves can be drawn on as equity to repair the balance sheets of organisations and sovereign entities in the basket case economies. That is precisely what happened when the Latin American countries looked like they were going to bring the whole world down with them in the 1970s and 1980s. Of course, the world economy did not collapse then, and the “sigh of relief” may be evidencing a realisation that it will not happen now.
It needs to be emphasised that 1-3 above do not represent “solutions” in the true meaning of the word, and that the world economy is indeed facing very challenging times ahead.
Interim Conclusion
The fear may be receding that the entire economic system may be in danger of collapsing – which might well explain why the gold price (and the prices of other “key” commodities) have been pulling back. An atmosphere of realism may be returning to replace the surrealism of the past three decades since Ronald Reagan pushed the debt engine button.
Unfortunately, as the fear of inflation recedes the fear of deflation is likely to manifest unless fundamental (non financial) economically stimulative action is pursued as a matter of Central Government policy across the globe. Therein lies the true value of what the Pentagon is proposing. If the Pentagon can point with confidence to technical solutions which will facilitate a transition from fossil fuel energy to non fossil fuel energy, then the implementation of their direction – with determination and across the planet – will be highly stimulative from an economic perspective.
The above interim conclusion begs the question: “What does the market as a whole believe?”
Unfortunately, the chart below (courtesy Bigcharts.com) is not reflecting as optimistic an outcome as my theories would argue.
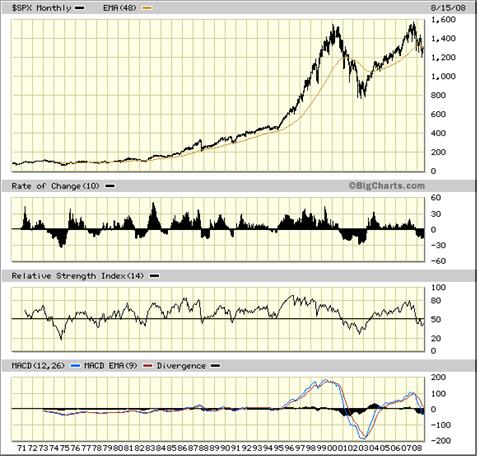
Based on this chart, whilst the industrial market “may” bounce from an oversold position, it appears to still have some significant unwinding ahead. The index is now sitting below its 48 month moving average and it has already bounced back towards the MA. The 800 – 1000 level may represent ultimate support, and the S&P 500 Index may be entering a trading range of between 800 and 1600 for many years to come. We should not lose sight of the possibility that the industrial markets might still drift down by up to 33% before it can be argued that a “depression” is in the offing.
Overall Conclusion
Whilst theory says that there may be solutions to our global problems, the industrial charts are not looking particularly optimistic. However, a glimmer of hope is manifesting from the commodity charts which, whilst weakening in the short term, are weakening within the context of Primary Bull markets remaining intact for commodities.
The evidence seems to suggest that we will muddle through. However, it will be entrepreneurial activity as opposed to financial engineering which will drive the world economy going forward.
By Brian Bloom
You may now order your copy of Beyond Neanderthal from www.beyondneanderthal.com . My guess is that we will both be glad you did. The feedback from readers has been very positive, and I am grateful for that. Via its light hearted storyline, the novel points a direction as to what we should be doing in the event that global cooling starts to manifest; and it also sows some seeds of ideas on how we might defuse the clash of civilisations
Copyright © 2008 Brian Bloom - All Rights Reserved
Disclaimer: The above is a matter of opinion provided for general information purposes only and is not intended as investment advice. Information and analysis above are derived from sources and utilising methods believed to be reliable, but we cannot accept responsibility for any losses you may incur as a result of this analysis. Individuals should consult with their personal financial advisors.
Brian Bloom Archive |
© 2005-2022 http://www.MarketOracle.co.uk - The Market Oracle is a FREE Daily Financial Markets Analysis & Forecasting online publication.