


A Look at the Silver/Gold Ratio, Inflation/Deflation and the Yield Curve
Commodities / Gold and Silver 2017 May 12, 2017 - 03:43 PM GMTBy: Gary_Tanashian

 An email from a reader (of the eLetter, I think) calling me out on trying to make too many correlations in a dysfunctional market (I think that was his bottom line point, and he’s got a good point) got me thinking about the Silver/Gold ratio and some pretty interesting post-2011 dysfunction (so it seems) in the markets.
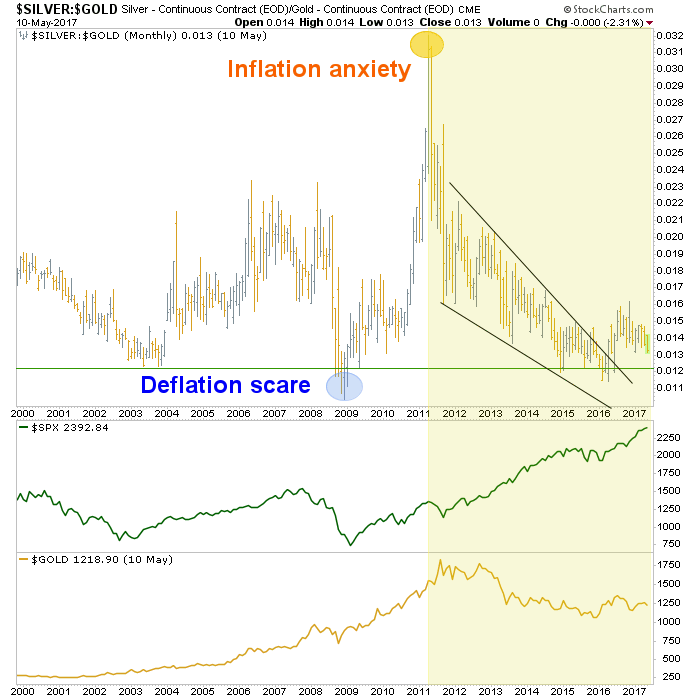
Markets that made sense in certain ways prior to 2011 no longer make sense in the same ways. For instance, the S&P 500 used to be correlated to the Silver/Gold ratio, which itself was positively correlated to inflation and/or inflationary economic growth. Gold also liked for silver to be leading it, not the other way around.
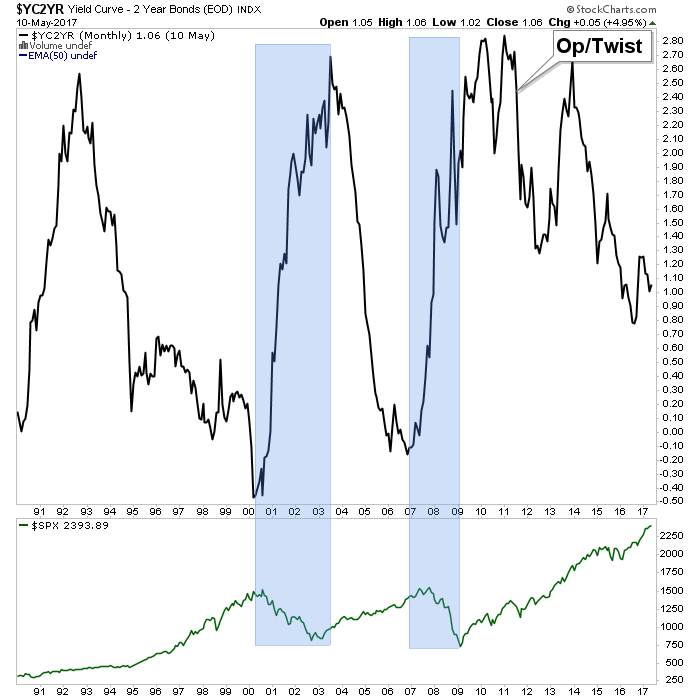
But in 2011 a Goldilocks environment was rammed home by Ben Bernanke’s decree (in September of that year) that the Fed would “sanitize” (his word for manipulate, coerce and completely screw up bond market signals that had been tried and true) inflation and its indicator signaling right out of the picture. The Fed’s ‘Operation Twist’ buying of long-term Treasury bonds and selling of short-term Treasury bonds forced a yield curve that had been out of control to the upside, downward. Brilliant!
In 2017 it’s the gift that keeps on giving, from dear old Ben as the resultant yield curve downtrend has been relentless and it has been stock bulls that have benefited despite the 2015 disturbance that temporarily shook a lot of people out of stocks. To be sure, Goldilocks has not only been Fed-induced, but also has benefited from global deflationary forces that now appear to be resolving toward an inflation phase in many global regions (here we again note Kevin Muir’s sound thought process about Europe potentially doing the US monetary policy thing).
Gold and silver, followed by commodities had once been obvious choices for inflationary phases, but now with the Fed out of tricks in its bag (leaving the heavy lifting to the Trump administration’s fiscal/reflation policy making), trying take back previous inflationary monetary policy (by slowly tightening) and the yield curve declining, it’s all good for now.
On this cycle (2011- ?) the inflation has clearly manifested in stocks. Funny money on the run, after all, is not discriminating money. It seeks assets… period. With gold having been harpooned due to the lethal combo of over-speculation and Bernanke’s not so gentle twisted shove in 2011, the stock market was a layup (in hindsight, at least) in 2011; it was the path of least resistance.
Will the next turn up in the curve be inflationary or of the deflationary liquidation variety? That will likely be determined by what nominal yields are doing at the time. Either way, a rise in the yield curve could be supportive for gold simply because a) gold often works well during inflation and b) because gold is currently wearing it risk ‘off’ suit, in the event an upturn in the curve is deflationary. In that latter event its price might not move up much, and could decline, but it would sure as hell retain value better than the stuff that has received the inflationary bid, post-2011.
Subscribe to NFTRH Premium for your 40-55 page weekly report, interim updates and NFTRH+ chart and trade ideas or the free eLetter for an introduction to our work. Or simply keep up to date with plenty of public content at NFTRH.com and Biiwii.com. Also, you can follow via Twitter ;@BiiwiiNFTRH, StockTwits, RSS or sign up to receive posts directly by email (right sidebar).
By Gary Tanashian
© 2017 Copyright Gary Tanashian - All Rights Reserved
Disclaimer: The above is a matter of opinion provided for general information purposes only and is not intended as investment advice. Information and analysis above are derived from sources and utilising methods believed to be reliable, but we cannot accept responsibility for any losses you may incur as a result of this analysis. Individuals should consult with their personal financial advisors.
Gary Tanashian Archive |
© 2005-2022 http://www.MarketOracle.co.uk - The Market Oracle is a FREE Daily Financial Markets Analysis & Forecasting online publication.