


Q4 Pivot View for Stocks and Gold
Commodities / Gold and Silver 2017 Oct 14, 2017 - 03:02 PM GMTBy: Gary_Tanashian

 Reference a post from August 11: Potential Pivots Upcoming for Stocks and Gold Stock Market Status
In the above-linked article we noted several legs that could be kicked out from under the S&P 500’s table in Q4 2017. The stock market blew right through one of them, which was a bearish (on average) seasonal trend for the 2nd half of September. No one indicator is a be all, end all. In sum, they define probabilities. But price is the ultimate arbiter and as of today, price says ‘still bullish’ (says Captain Obvious).
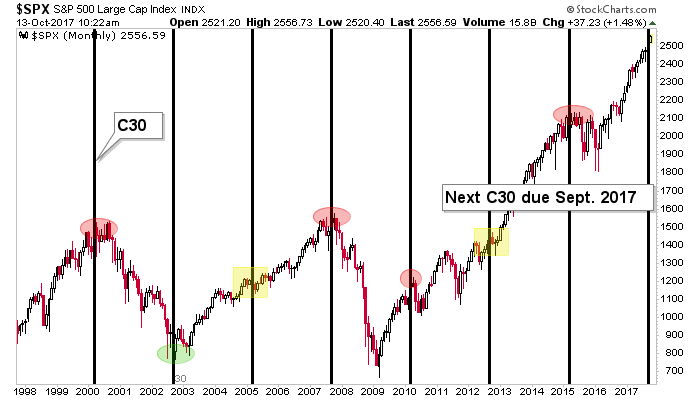
Another leg was the 30 month cycle that has caught 5 of 7 important tops or bottoms (4 tops, 1 bottom) since 2000. As noted when it was first presented, this monthly chart takes into account months of slush in and around the 30 month mark, so it is far from an exact timer. The S&P 500 remains in the window with the September bar now in play.
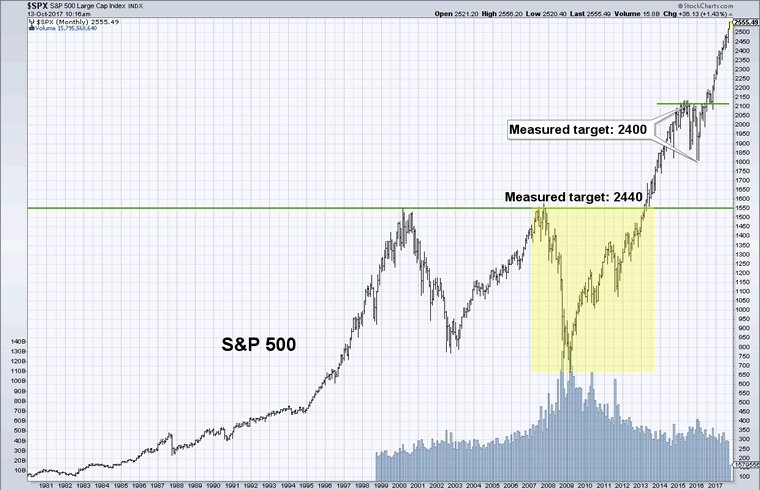
Another factor was that our measured targets, which we’d plotted when most people were bearish on the market *, had been exceeded. See a post from earlier this week showing more big pictures of US stock indexes and their targets along with global markets, commodities, gold and silver. Most stock market charts shown in the post remain extremely bullish on the big picture (again, Captain Obvious).
As for this chart, targets are never stop signs, but the point is that the bullish measurement is no longer out there in waiting as a bullish factor. It’s long-since in the books.
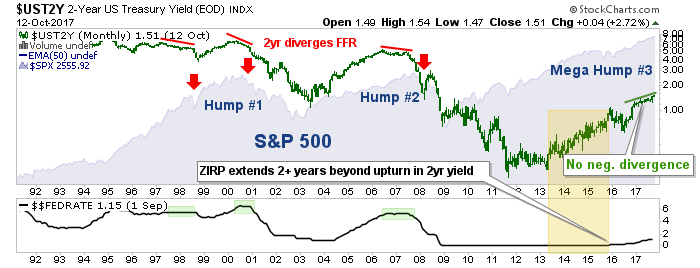
We also noted the Fed’s rate hike cycle, which had gotten under way but was currently not indicating imminent danger. That is still the case, as the Fed Funds Rate is safely below the 2 year yield, which remains in an uptrend (i.e. no negative divergence). It should be well known that the stock market usually continues to climb in the early stages of a Fed rate cycle.
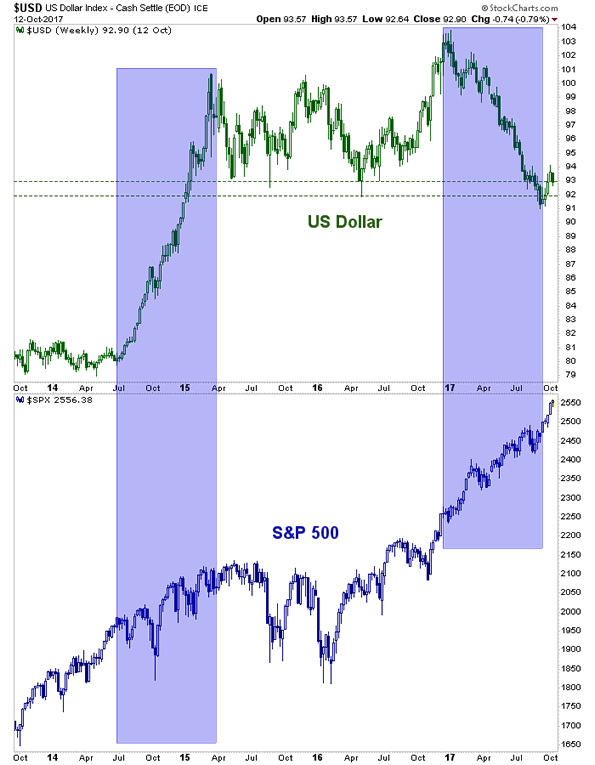
We also noted that several other considerations make up the 4th leg of the S&P 500’s table. Let’s look at a couple of them. We caught the 2014 USD upturn in real time the US dollar index made a higher high in August of that year. That started the clock ticking on a coming bear phase in the US stock market, which would affect multi-national exporters first and foremost. While there was a sharp correction a couple of months later the market did not really roll over until a year after Uncle Buck first turned up.
But the blue shaded area on the right shows a stark contrast between a declining USD and rising SPX. The logical thinking being that ‘if Trump is planning to reflate through fiscal policy a weaker dollar would be a key underpinning to that’. So I for one do not think it is set in stone that a rise in USD needs to wait a year before it corrects the stock market. However, as our ‘USD bounce’ view finally played out recently, the market had other ideas; it kept going up! That’s show biz folks. So either the stock market is wrong or the reflationary thesis is wrong.
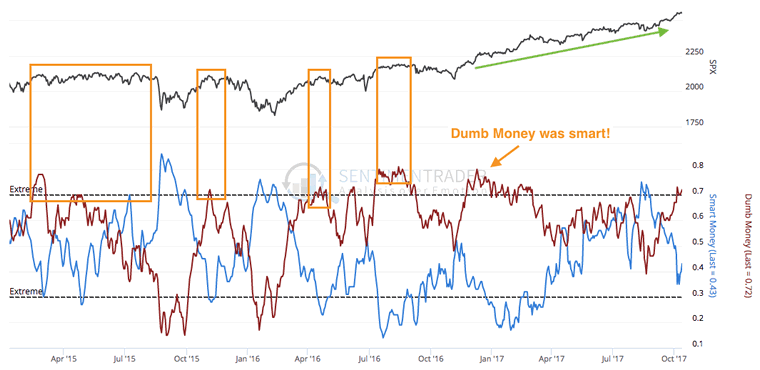
Another 4th leg component is market sentiment, which had been persistently lukewarm. Well, lately it is heating up. Here are the “Smart” and “Dumb” money readings per Sentimentrader‘s indicators. There is no denying that the Trump rally turned the market on its ear as the usual contrary indicators were not contrary at all, post-election. Most recently, Dumb money is buying the rally and Smart is fading again. The readings are finally approaching, though not at extremes. Other sentiment indicators like the most recent (Oct. 10) Investors Intelligence reading on market newsletter writers (60% Bulls, 15% Bears) are well into extreme over bullish territory. The VIX as we know, is pinned to the mat. The market is over bullish, which is a condition for a top, although not a timer for one.
The bottom line is that 2 months after the original article was written, the stock market labors on, sucking in or obliterating all who would deny the bullish case. The Q4 time window is at hand, the Fed is talking hawk (although the funds rate vs. the 2yr yield is still benign), the US dollar is firming and sentiment is pointing toward an extreme over bullish condition. There is not much standing in the way of a market correction except for two important items… price and trend which are both massively positive. Shorting this market is done at great risk until there is a crack in those items (I tried a ‘what the hell?’ limited commitment short yesterday, against long positions).
* I repeat this when presenting a bearish case because perma-bears have been presenting a bearish case at every negative blip in the stock market. I may well be wrong on the Q4 top view, but you will know that the thesis is presented by someone who was appropriately bullish in the depths of the Brexit/NIRP angst of the summer of 2016… using many of the same indicators shown above.
Gold & Gold Stocks Status
In the mirror is counter-cyclical gold and the gold stock sector. We have maintained all through the bear market and into the current potential bull phase that the sector will not be ready for prime time until after the stock market tops out. The gold sector could thrust bullish in unison with a stock market top or it could grind under pressure from market liquidity drainage in the short-term. But make no mistake, the gold sector will shine at some point after the stock market tops (for a hard correction at least).
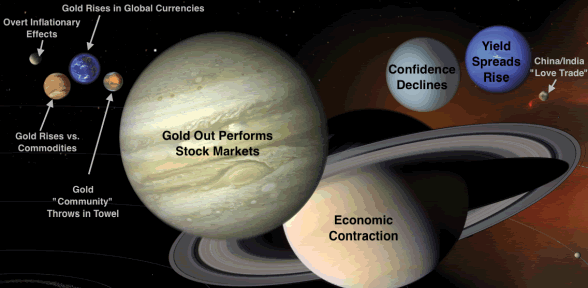
Here is my favorite cartoon version of some important gold sector fundamentals, the Macrocosm, with the biggest planet out front being the most important to the current situation. The two tiniest planets can be all but ignored as they are the stuff of promotion or lazy analysis.
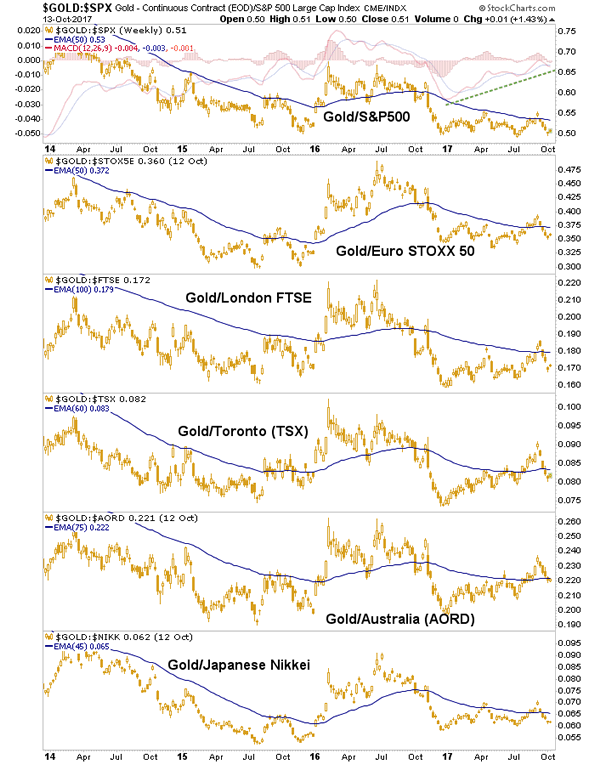
The most recent surge in speculative markets along with interest rates has pretty much wrecked the sector’s fundamentals once again. Here is just one of several macro views (we also chart gold vs. commodities, currencies and bonds) we use to show a positive or negative backdrop for the gold sector. As you can see, gold vs. stock markets is negative, although Gold/S&P 500 is sporting an interesting MACD divergence.
On Wednesday night we updated the daily and weekly technical status of the HUI index, and little has changed since. Check out the link. It is important to watch the nominal technicals along with the macro technicals like the chart above because the nominal daily technical situation is likely to lead the weekly macro fundamental situation.
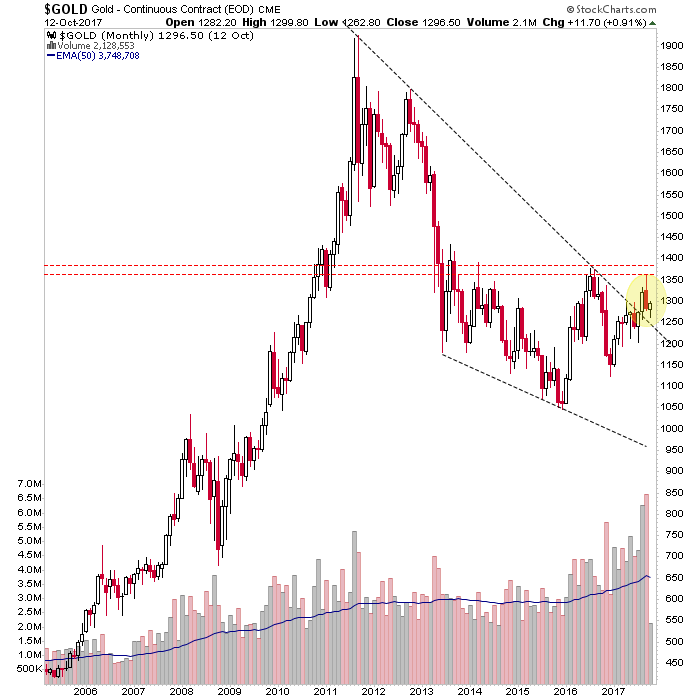
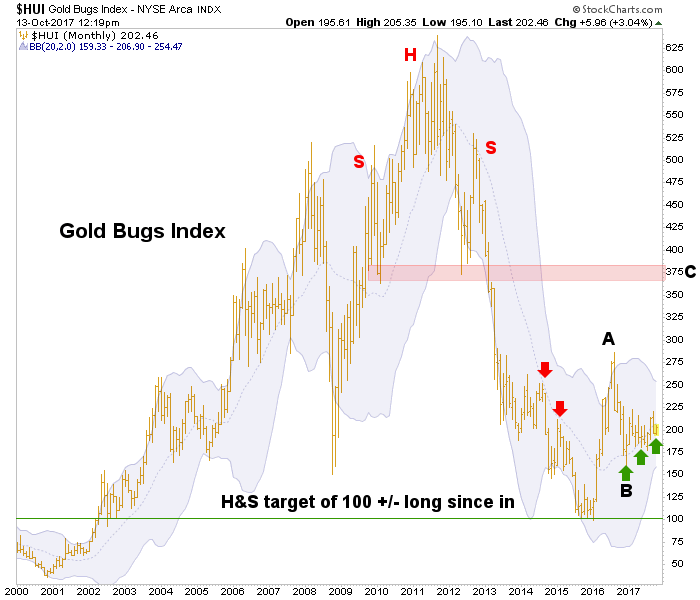
We’ll close with big picture monthly views of nominal gold and HUI. Gold did rise after the original ‘pivot’ post and projecting it to find resistance in the high 1300s was easy, as this is a key line between a bear and bull market. It was not going to be given up easily, especially with speculation running too hot amid the Trump/Rocket Boy hysterics. You do not buy gold on geopolitical hype. Shorter-term charts show that gold pulled back to support in the mid-1200s and can renew its rally.
HUI monthly has been grinding the mid point of the Bollinger Bands as it tries to establish a new bull phase using that parameter as a marker (green arrows) as it did during the bear market (red arrows). Huey is currently below that point but it routinely jabs down below it in-month.
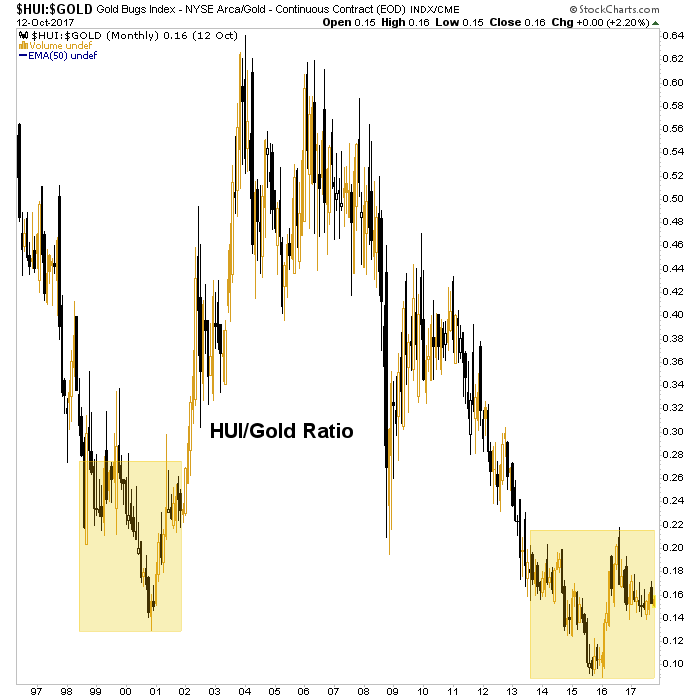
Why not finish with a chart of the ratio between these two items, the HUI/Gold ratio. While the daily HGR is grappling for support between its 50 and 200 day moving averages, the monthly view shows a bullish looking pattern we have been tracking for several months now. This ratio is a key leading indicator for the sector.
The bottom line is that the gold sector is stable and in waiting for difficulties in the stock market and other heavily gamed areas of the investment world. If markets begin a routine but persistent correction the gold sector need not get sucked down with stocks. If we have a classic fall liquidity event, the gold sector could take a hit before a sustained rally takes place. If on the other hand the stock market mania continues firmly in the weeks and months ahead, the gold sector will wait until the massive asset speculation (i.e. generalized bubble) terminates before it offers anything special for investors.
That is why it is best to have patience, at least for the next couple of months, considering that gold’s seasonal average bottoms in December or January. As with the September stock market seasonal, this can be taken with a grain of salt. But that’s what we do in markets; we use as many tools as possible to refine probabilities.
While my Q4 ‘macro pivot’ view is still viable, my view that the gold sector is in wait for whenever the macro speculative environment blows out remains firm. In that event gold would out perform most assets and so, improve sector fundamentals for the miners. The HUI/Gold ratio above is all about such leverage. If it goes bullish as its pattern implies, that leverage will be on display. That is why we are keeping tabs on 29 different gold stocks each week, with the majority being of relative quality.
If you are thinking of subscribing to NFTRH, do so before the rate for this relatively value-priced service increases, albeit modestly. As pertains to the gold sector, we managed risk to an extreme in 2012 to avoid the bear market and hold on to gains. Today I look forward to working with you in seeking profits from the uniquely counter-cyclical sector. First, markets must pivot.
Subscribe to NFTRH Premium for your 40-55 page weekly report, interim updates and NFTRH+ chart and trade ideas or the free eLetter for an introduction to our work. Or simply keep up to date with plenty of public content at NFTRH.com and Biiwii.com. Also, you can follow via Twitter ;@BiiwiiNFTRH, StockTwits, RSS or sign up to receive posts directly by email (right sidebar).
By Gary Tanashian
© 2017 Copyright Gary Tanashian - All Rights Reserved
Disclaimer: The above is a matter of opinion provided for general information purposes only and is not intended as investment advice. Information and analysis above are derived from sources and utilising methods believed to be reliable, but we cannot accept responsibility for any losses you may incur as a result of this analysis. Individuals should consult with their personal financial advisors.
Gary Tanashian Archive |
© 2005-2022 http://www.MarketOracle.co.uk - The Market Oracle is a FREE Daily Financial Markets Analysis & Forecasting online publication.