Latest FDIC US Banking Systems Report Reads Like a Horror Novel
Companies / Credit Crisis 2008 Aug 31, 2008 - 01:28 PM GMT Mike Larson writes: Every three months the Federal Deposit Insurance Corporation (FDIC) puts out "Quarterly Banking Profiles." Most investors have never heard of them. The mainstream press has largely ignored them. Even Wall Street traditionally pays them little heed.
But not me! The QBP provides a wealth of information about the state of the U.S. banking industry. It tells you about the credit quality of the loans on the books of U.S. banks, what's going on with bank earnings, how much money the FDIC has on hand to resolve failing institutions, and more.
I've been reading these things for a long time, and reporting on the details to you. I've noted how the numbers were progressively getting worse. I even told you way back in November that based on some of the data I was seeing, we could be facing a " New Savings and Loan Crisis ."
Now, Wall Street is FINALLY paying attention. Heck, the release of the second-quarter QBP was a major media event — CNBC covered it live. Why?
Because The Latest QBP Reads Like A Banking Industry Horror Story!
It's chock full of creepy statistics, spooky charts, and downright scary surges in all kinds of delinquency and default indicators.
Let me go through several key passages (some emphasized in bold ) with you now, and explain what they all mean ...

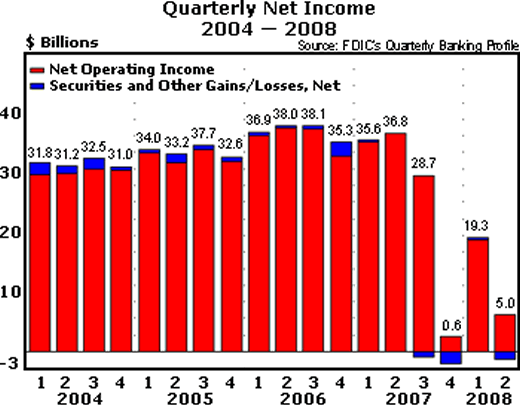
QBP: "Insured commercial banks and savings institutions reported net income of $5.0 billion for the second quarter of 2008. This is the second-lowest quarterly total since 1991 and is $31.8 billion (86.5 percent) less than the industry earned in the second quarter of 2007."
Translation: Earnings are collapsing throughout the financial sector as bad debts mount and write-downs on complex securities surge. Banks are being forced to set aside greater and greater amounts of money to cover loans they expect to sour down the road.
QBP: "Loss provisions totaled $50.2 billion, more than four times the $11.4 billion quarterly total of a year ago . Second-quarter provisions absorbed almost one-third (31.9 percent) of the industry's net operating revenue (net interest income plus total noninterest income), the highest proportion since the third quarter of 1989."
Translation: Banks are required to take loan loss provisions when they believe loans will go bad. The fact that provisions are soaring shows that major financial players are expecting future losses to surge.
QBP: "Loan losses registered a sizable jump in the second quarter, as loss rates on real estate loans increased sharply at many large lenders. Net charge-offs of loans and leases totaled $26.4 billion in the second quarter, almost triple the $8.9 billion that was charged off in the second quarter of 2007 . The annualized net charge-off rate in the second quarter was 1.32 percent, compared to 0.49 percent a year earlier. This is the highest quarterly charge-off rate for the industry since the fourth quarter of 1991."
Translation: Banks charge off bad loans and leases when they believe they won't be able to collect on them. The dramatic increase here is more bad news for the banking sector.
QBP: "Net charge-offs increased year-over-year for all major loan categories in the second quarter. Charge-offs of 1-4 family residential mortgage loans increased by $5.8 billion (821.9 percent) , while charge-offs of real estate construction and land development loans rose by $3.2 billion (1,226.6 percent) . Net charge-offs of home equity loans were $2.8 billion (632.7 percent) higher than a year earlier, charge-offs of loans to commercial and industrial (C&I) borrowers were up by $1.8 billion (127.5 percent) , credit card charge-offs increased by $1.7 billion (47.4 percent) , and charge-offs of other loans to individuals grew by $1.4 billion (70.3 percent) ."
Translation: Anyone who claims that this is just a residential mortgage problem isn't doing his homework. We're not only seeing staggeringly large increases in charge-offs in residential mortgage and real estate construction and development loan portfolios. We're also seeing charge-offs rise sharply in credit cards, personal loans, and core business loans.
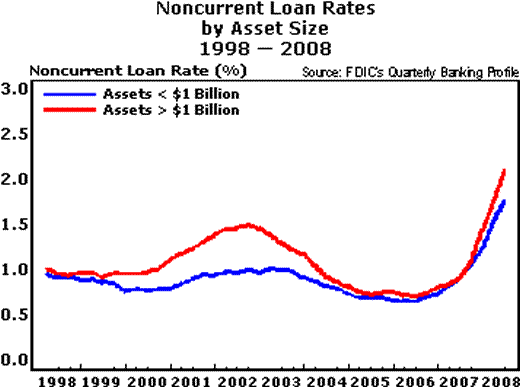
QBP: "The industry's ratio of reserves to total loans and leases increased from 1.52 percent to 1.80 percent, its highest level since the middle of 1996. However, for the ninth consecutive quarter, increases in noncurrent loans surpassed growth in reserves, and the industry's "coverage ratio" fell very slightly, from 88.9 cents in reserves for every $1.00 in noncurrent loans, to 88.5 cents, a 15-year low for the ratio."

Translation: Banks are drastically increasing their bad loan reserves in anticipation of defaults. But "noncurrent" loans — those which are at least 90 days past due or no longer accruing interest — are rising even faster. That means reserves will have to rise even HIGHER to keep pace with all the bad debt growth.
QBP: "The number of institutions on the FDIC's "Problem List" increased from 90 to 117 during the quarter. Assets of "problem" institutions increased from $26.3 billion to $78.3 billion."
Translation: The FDIC maintains a list of troubled institutions that rank either a "4" or "5" on its internal, non-public risk scale. The number of banks on that list surged 30% quarter over quarter and is now at the highest level in five years. The total assets held at those problem institutions has ballooned to more than $78 billion.
What This Bad Banking Report Means to You ...
Nine institutions have already failed this year. That compares with three last year and none in 2005 and 2006. In fact, this is the most failures we've had in any year since 2002 — and we still have four months to go.
Judging by the news in the latest QBP, this failure wave is not going to crest anytime soon. So ...
First, it is imperative that you assess your exposure to possible failures in this environment! Review your accounts to see if you have full FDIC insurance coverage. The cap is generally $100,000 for regular accounts and $250,000 for retirement accounts like IRAs, though there are ways to increase your total coverage. [Editor's Note: You can find out more at the FDIC's website .]
Second, don't just stick your money in any old bank offering the best interest rate! Oftentimes, the banks offering the highest deposit interest rate are the ones that are most desperate for cash. Their other funding sources have either been cut off or curtailed, so they end up bidding for funds from the public.
If you sock too much money (more than is covered by FDIC insurance) in one of these banks and it goes under, you may not get all of your money back. At the very least, it could take time to recoup your funds. Can you afford to have your cash tied up?
Third, check your bank's safety! The FDIC doesn't release the names of the institutions on its "problem" list. But that doesn't mean you have to live in the dark. Several private services analyze bank capital, profitability, liquidity, asset quality, and other factors, then generate bank ratings based on the data. These ratings can give you a general idea about which banks are financial sound ... and which may not be.
Martin and I discussed bank safety ratings and how to check them in a recent presentation. You can access it here . But keep in mind that ratings are always changing as new information becomes available. So I recommend you monitor your bank on an ongoing basis using tools like TheStreet.com's ratings system.
Bottom line: As the QBP demonstrates, this is no time to take chances with your money — either in risky financial stocks or risky underlying banks.
Until next time,
Mike
P.S. While the U.S. is mired in financial problems, my colleague Tony Sagami sees continued growth on the ground in Asia. And he's about to send out his next recommendation to his Asia Stock Alert subscribers.
If you're not a subscriber, sign up now for a risk-free trial to Asia Stock Alert by 3 p.m. on September 12 to get that new pick the minute he fires it off. You'll be able to immediately download six special reports on other great Asian stocks. Click here for all the details.
This investment news is brought to you by Money and Markets . Money and Markets is a free daily investment newsletter from Martin D. Weiss and Weiss Research analysts offering the latest investing news and financial insights for the stock market, including tips and advice on investing in gold, energy and oil. Dr. Weiss is a leader in the fields of investing, interest rates, financial safety and economic forecasting. To view archives or subscribe, visit http://www.moneyandmarkets.com .
Money and Markets Archive |
© 2005-2022 http://www.MarketOracle.co.uk - The Market Oracle is a FREE Daily Financial Markets Analysis & Forecasting online publication.


