


How Inflation Reduces The Real Value Of Social Security Net Of Medicare Premiums
Economics / Government Spending Feb 19, 2018 - 03:36 PM GMTBy: Dan_Amerman

 For most retirees age 65 and over, the spending power which they rely on from government retirement programs is their Social Security benefits after their Medicare Part B premiums have been withheld.
Because Social Security is in theory supposed to be fully inflation indexed, many people believe their standards of living in retirement will be fully protected from inflation. However, when we look at what matters the most, which is the purchasing power of Social Security net of Medicare premiums - that particular number has never been intended to keep up with the rate of inflation, as a matter of design.
Current retirees have received a rude wake-up call in recent years, with the increases in their Medicare Part B premiums consuming almost all of their very small increases in Social Security benefits. This is a process that is, however, still in its early stages. Particularly if higher rates of inflation are indeed returning, then the impact on retiree standards of living may be swift, powerful and sustained.
Crucially, this is a repetitive and cumulative process. This creates an unfortunate knowledge mismatch between the generations. Those who are currently retired are generally well aware - but they do not face the worst of the financial damage. It is those who are not yet of retirement age that face the greatest risk to their financial plans - but they are also the least likely to be aware of these issues.
The goal of this sixth analysis in a series is to give you an early and comprehensive understanding of what is likely to become a defining challenge for an entire nation when it comes to both personal and national standards of living in retirement. An overview of the first five analyses and other related analyses is linked here.
Social Security Net Of Medicare Is Not Fully Inflation Indexed
In the previous Part 5 analysis, we conceptually explored eight factors that will be driving Medicare premiums up at a higher growth rate than the future increases in Social Security benefits. Projecting a substantially higher growth rate in Medicare premiums is not the slightest bit controversial, but rather it is almost universally expected by the experts who study these issues. It is also built right in to the federal government's own long-term financial projections.
The mathematics of the increasing premiums are quite clear - multiple factors will merge together to reduce standards of living in retirement to a degree that will that will grow steadily stronger over time. This will impact everyone who is enrolled in both Social Security and Medicare - there is no opting out.
Yet, very few people are aware of this or are properly taking it into account.
To make this vitally important information more accessible and understandable, we will separate out three different issues, and isolate the real world impact for an average retiree. This analysis will focus on one simple but life changing question - what happens to the inflation protection for net benefits in an individual year when Medicare premiums increase at a different rate than Social Security benefits?
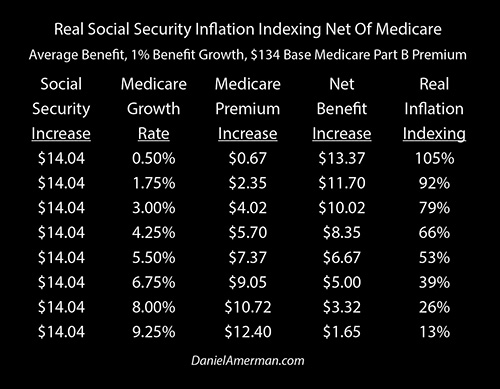
We can see an example of how this works at various levels of percentage increases in Medicare premiums in the table above.
As our starting point we're assuming a monthly gross Social Security payment of $1,404 dollars which is the national average for 2018. The base Medicare Part B premium in 2018 is $134. So if we take a $1,404 benefit and withhold a $134 Medicare Part B premium, this means that for the average retiree their net payments for 2018 - what they can actually spend - are about $1,270 per month, or a little over $15,000 per year.
Over the last three years in practice we have seen Social Security benefits climbing at a rate (again, this is covered in the previous analyses) of about 0.75% per year. For this first example we'll increase that a little bit, and assume benefits go up by 1.0%. A 1.0% benefit increase on a starting benefit of $1,404 works out to be $14.04 dollars a month, as can be seen in the "Social Security Increase" column on the far left.
The next question is how much Medicare premiums increase in any given year, and the "Medicare Growth Rate" column has a number of possibilities. In practice, base Medicare Part B premiums have gone up by an average of about 8.5% per year over the last three years. For this first example, we'll bring that down a bit and assume an 8% increase.
If we multiply our base $134 Medicare Part B premium times 8%, that means that our Medicare premium is going up by $10.72 cents per month, as can be seen in the "Medicare Premium Increase" column.
So if the gross Social Security benefit increase goes up by $14.04, and the Medicare premium goes up by $10.72, that means that the average retiree would receive a net benefit increase by only $3.32, as seen in the "Net Benefit Increase" column, This means that their new net benefit is about $1,273.
If the retiree standard of living is based on net Social Security benefits of $1,270, then to keep up with a 1% rate of inflation, they would need an increase in their net benefits of $12.70 per month, and a new net benefit of about $1,283. But the increase in Medicare premiums mean that their net benefit only increased by $3.32. This means that they are $9.38 short ($12.70 - $3.32) of keeping up with the rate of inflation.
Another way of looking at this is that because the retiree needed a $12.70 monthly increase in net benefits to fully keep up with inflation and protect their standard of living, but they only received a $3.32 increase, then their "Real Inflation Indexing" as shown in the rightmost column is only 26% ($3.32/$12.70 = 26%). In that case, with the particular set of assumptions in this example, only 26% of their lifestyle is protected from inflation, and the other 74% of their lifestyle is vulnerable to being eaten away by inflation over time.
A Repetitive & Cumulative Process
Losing $113 in annual purchasing power next year might not seem like such a big deal, particularly if we are not the one is who is currently trying to find a way to live on net benefits of a little over $15,000 a year (which is the average).
The issue is that this is not a one-time event - but a repetitive and cumulative process, as a result of the eight factors covered in the Part 5 analysis. If the same thing happens the next year, then the retiree starts off being $113 behind, and then they stack another $113 shortfall on top of that. Then for year three they start off at $226 in the hole, and then add another $113 reduction in standard of living on top of that.
(The above is not the actual math, but is instead a simplified version intended to make the example easier to follow. Other analyses in this series do use a more precise methodology.)
If we then project that process forward over a 15 or 20 year retirement then we are talking about a potentially major reduction in the standard of living that can be supported by Social Security benefits net of Medicare premiums - and remember this applies to everyone to the extent their standard of living in retirement is based upon Social Security and Medicare.
Current Retirees Are Not The Most Vulnerable Group
An interesting part of writing this series has been the feedback I have been receiving. Generally, people who are currently retired and receiving Social Security benefits while paying Medicare premiums understand exactly what I'm talking about, and they can sometimes get quite worked up about it. How could they not understand? This is their lives, this is happening to them for real right now, and they see it every year as Medicare premium increases consume almost all of their small Social Security benefit increases.
In general, with people who are not yet retired and for whom Social Security and Medicare are still a number of years in the future - they are not as interested, and they can even be somewhat skeptical. This is not the conventional wisdom, this is not part of their current financial planning - how could this be true, how could this be happening without their knowing about it?
As previously described, there is a somewhat ironic generational knowledge gap here. As current retirees know quite well, there has been a breakdown in practice when it comes to the effective inflation indexing of net Social Security benefits. The average retiree has seen their net benefits go up by only $2 in the last three years, they know it, and they don't like it at all.
However, for those who are younger and are responsibly saving for retirement while making financial plans for their retirement - this is not generally part of the process. Indeed, a breakdown in effective Social Security inflation indexing is often excluded by definition when it comes the financial models that are used by many experts, and which form the foundations for much of the accepted wisdom on retirement planning. This issue is described in the excerpt below from my "Personal Math versus Abstract Theory" analysis (linked here):
"But yet, the conventional wisdom and the reported "best advice" don't seem to be changing in the slightest. There seems to be an almost complete disconnect between the mathematical serenity of the accepted theory, and what is actually being experienced by retirees in reality."
What makes this particularly unfortunate is that the current retirees are not the ones with the biggest problem here - it is those who are younger and not yet retired that will be bearing by far the worst of the financial consequences.
To better understand this, let's consider two people: Frank and Linda. Frank is 75 years old and knows all about how Social Security and Medicare work. Linda is 55 years old, and intends to retire in 10 years at age 65.
Linda and Frank talk every now and then, and Linda feels bad for Frank when he vents about how his income is not keeping with inflation, and the greater sacrifices he has to make each year to keep his spending down. But she doesn't personally connect this to her own life and her own financial planning - after all, she reads some of the best financial advice that is available.
Ten years go by, and Frank passes on at age 85, having had the purchasing power of his net Social Security payments fall ten times, which added up to a cumulative total of $1,130 in his last year (using simplified math).
That same year, Linda retires at age 65 - and finds all ten of Frank's annual problems lined up and waiting to greet her as she starts retirement. Each year that Frank's actual Social Security payments were increasing at too low of a rate - the base that would determine the size of Linda's first Social Security payment was increasing at that exact same too low of a rate. Each year that Frank's actual Medicare premiums were rising at too fast of rate - the base premium that Linda would begin paying at age 65 when she enrolled in Medicare was rising at that exact same too fast of rate.
The worst financial pain that Frank felt over his 20 year retirement came in his final year, because that was the year of the lowest purchasing power of his Social Security benefits net of Medicare premiums.
The first year of Linda's retirement (assuming equal inflation-adjusted Social Security benefits), the purchasing power of her net benefits start at the same place that Frank's ended - a reduction of $1,130 when compared to the purchasing power of net benefits ten years before. The 19 previous years of more valuable payments that Frank lived on for almost his entire retirement are not available to her, they are in the past and gone.
Instead, the worst financial year of Frank's retirement becomes the best financial year of Linda's retirement, and it gets a little worse each year.
The second year of Linda's retirement she has a lower purchasing power for her net benefits than Frank ever experienced. By the time she is 75, her purchasing power is down by a cumulative total of $2,260 per year. By age 85, she is trying to make ends meet with a purchasing power that has been reduced by $3,390 per year (using simplified math).
I do very much appreciate the feedback that I receive from people who are currently retired, and I am glad that you are finding value in these analyses. But if you are retired and have children - you are not the one in your family who needs this kind of information the most.
If you have a son - he has a much greater financial exposure than you. And if you have a daughter - she has the greatest financial exposure of all, given the combination of longer expected lives for women in retirement and the very lowest purchasing power being found in the last years.
This is all truly quite ironic. Every year that Social Security goes up by a very low amount - it doesn't just change the income of every current retiree, but it also reduces the benefits in every future year for every person who will ever be collecting Social Security. Because the base is lower, and all future percentage increases from there forward will be worth less as they are based upon that smaller base.
Medicare Part B premiums are different because they are based on the shared pool that was explored in the Part 5 analysis. But nonetheless, anytime the base is increased - it tends to stay that way. The former level becomes history, and it becomes easier to add to that base than would otherwise be the case.
Social Security benefits and Medicare premiums are each exponential series, even if few people think about them in those terms. And when the compounding rate of any exponential series gets messed with, the short term consequences are trivial compared to what happens farther down the road.
If people only understood how the math really works, then there would be very different reactions to low Social Security benefit increases or high Medicare premium increases. As it is, only the retirees seem to be getting worked up and writing the angry letters. If more people in their 40s and 50s truly understood, then they would be deluging their representatives with emails and phone calls. And if people in their 20s and 30s truly understood, they would be taking to the streets in protest.
But that is not the way the world works, and our reality is that those who will be the most affected are often those who are the least likely to be aware of these issues, or to even be interested in them.
A Wide Range For Real Inflation Indexing
There are of course many other possibilities when it comes to possible future Medicare premium increases, and the resulting real inflation indexing.
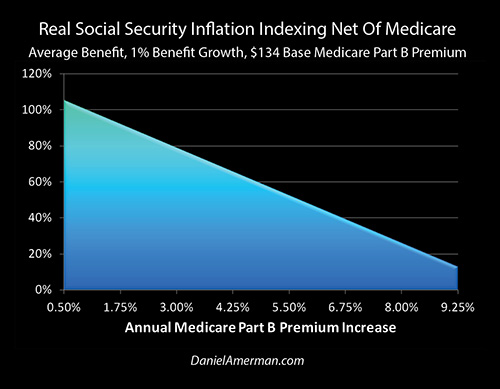
The graphic above is a visual representation of the previous numbers chart. If there is no increase in Medicare premiums while gross Social Security benefits do increase, or if the rate of increase is greater with Social Security benefits than with Medicare premiums, then we can get a small increase in the purchasing power of net benefits, as can be seen on the left edge of the graph.
If we have annual Medicare premium increases of just 3% - which is below the historical average for medical expenses as a whole and does not include the other seven factors from the Part 5 analysis - then we have only 79 percent inflation protection.
If we have annual Medicare premium increases of 5.5% per year, then we have inflation protection that's only equal to 53 percent of inflation and almost half of inflation is coming straight out of our standard of living. Social Security is simply not fully inflation indexed as is covered in much more detail from multiple other angles in the previous analyses.
Higher Retiree Expense Growth
Another issue that's been developed in depth in this series, particularly in Parts 2 & 3, is that of retiree expenses growing at a different rate than the increases in Social Security benefits that are being received.
This greatly increases the issues when we take into account an index mismatch and we also look at the net purchasing power of Social Security benefits.
As an example let's say that an individual retiree's expenses a growing at rate of 2% per year, Social Security benefits are growing at 1% per year, and Medicare premiums are growing at a rate of 5.5% per year.
If our expenses have increased by 2%, then our net benefit of $1,270 needs to increase by 2%, which means we need an additional $25.40 to maintain our lifestyle. With a 1% Social Security increase we're only getting an additional $14.04 on a gross basis.
And with Medicare premiums going up by 5.5%, they increase by $7.37, and we are left with an increase of only $6.67 in our net benefits.
We needed a $25.40 increase, we only got a $6.67 increase, and that means our real inflation indexing is only 26%. That's a reduction of about $225 dollars a month in purchasing power in the first year.
Because this is a repetitive and cumulative process, this can quickly becomes quite problematic for someone who is in an average situation. Fortunately it is true that many people been saving so they do have other financial resources to draw upon.
However as estimated in a recent study by the Stanford Center On Longevity, for the average middle-class retiree Social Security will be producing about 50% to 85% of the actual income they're going to be living on in retirement.
This means that we're talking about a steady annual decrease for the retirees of the nation in more than half of the income that they are relying upon to cover their standard of living in retirement.
When The Gross Payment Is Not Keeping Up With Inflation
There is a separate mathematical issue when it comes to when Social Security benefits are received and what their purchasing power is, as is covered in the Part 1 analysis. There is an initial lag between when inflation is measured and when retirees start to get their COLA increases in January. Then there is another lag in terms of those benefits being worth a little less in each of the following months.
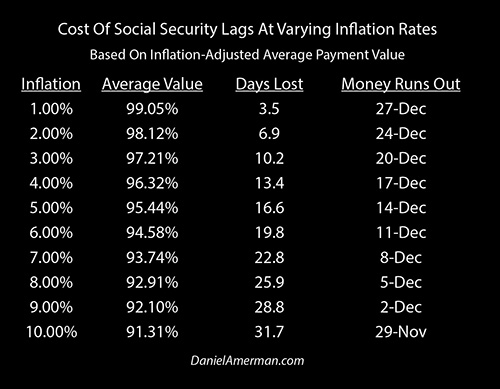
As shown in the table above, when we mathematically take that into account, then the higher the rate of inflation, the lower the value of our benefits.
So we then have the 1-2 combination of increasing rates of inflation reducing the real purchasing power of the beginning Social Security payment, and then we further reduce that for the higher rate of inflation on Medicare premiums, and then we potentially further increase that for the degree to which retiree expenses are increasing at a faster rate than Social Security benefit increases.
With all of these factors are working together through time.
Indeed, the more factors that we take into account, the more likely it is that some of the most important decisions we will make about retirement will change, as explored in the Social Security analysis linked here.
Other Intersections
The intersection between Social Security benefits and Medicare premiums that was isolated and explored in this particular analysis is by itself enough to have life changing consequences for many retirees. However, it is isn't only "intersection", and it isn't the only issue that most people are not properly taking into account.
Using another simple to follow example, in the next analysis we're going to take a mathematical look at something else that was conceptually introduced in our Part 5 analysis, which is the little examined but critically important financial impact of the "hold harmless" provision of Social Security on individual retiree finances. As we will explore, this unequal division of the expenses of a shared pool will change the lives of different retirees in a very unequal manner.
Daniel R. Amerman, CFA
Website: http://danielamerman.com/
E-mail: mail@the-great-retirement-experiment.com
Daniel R. Amerman, Chartered Financial Analyst with MBA and BSBA degrees in finance, is a former investment banker who developed sophisticated new financial products for institutional investors (in the 1980s), and was the author of McGraw-Hill's lead reference book on mortgage derivatives in the mid-1990s. An outspoken critic of the conventional wisdom about long-term investing and retirement planning, Mr. Amerman has spent more than a decade creating a radically different set of individual investor solutions designed to prosper in an environment of economic turmoil, broken government promises, repressive government taxation and collapsing conventional retirement portfolios
© 2018 Copyright Dan Amerman - All Rights Reserved
Disclaimer: This article contains the ideas and opinions of the author. It is a conceptual exploration of financial and general economic principles. As with any financial discussion of the future, there cannot be any absolute certainty. What this article does not contain is specific investment, legal, tax or any other form of professional advice. If specific advice is needed, it should be sought from an appropriate professional. Any liability, responsibility or warranty for the results of the application of principles contained in the article, website, readings, videos, DVDs, books and related materials, either directly or indirectly, are expressly disclaimed by the author.
© 2005-2022 http://www.MarketOracle.co.uk - The Market Oracle is a FREE Daily Financial Markets Analysis & Forecasting online publication.