


Baidu (BIDU) Resuming the Bullish Cycle
Companies / Company Chart Analysis Feb 20, 2018 - 01:04 PM GMT

 Baidu, Inc. (NASDAQ: BIDU) is one of the largest Chinese multinational technology companies specializing in Internet-related services & products and one of the premier AI leaders in the world.
Last week, Baidu has reported excellent results in Q4 which helped its stock to bounce +15%. Solid margin expansion and good developments on several fronts were on the headlines behind the recent rally which switched the opinion of many major investment firms to the bullish side.
We at Elliott Wave Forecast believe the market is ruled by the technical aspect and fundamental news comes in the second place to drive the price to a pre-determined direction. Therefore, we’ll take a look at the 4H chart of BIDU and analyse it using the Elliott Wave Theory.
BIDU 4H Chart 02.20.2018
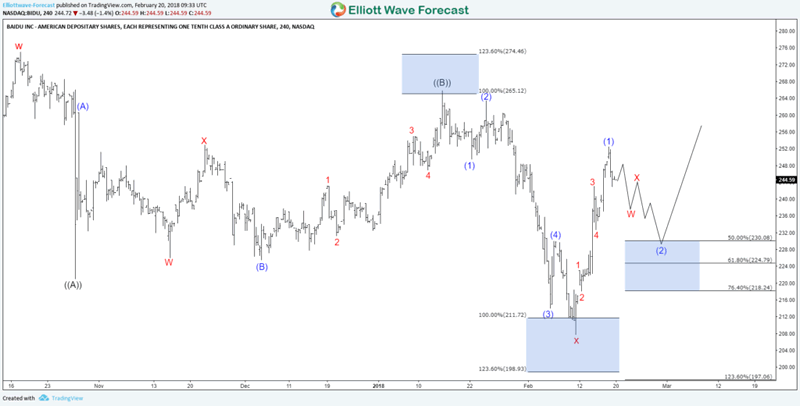
Since October 2017 peak, BIDU did a typical 3 waves correction to the downside which reached equal legs area $211 – $198. Up from there the stock started a new cycle higher and looking to break above $275 peak later on to open a bullish sequence higher.
Currently, the stock ended 5 waves from the lows and expected to see another 3 waves correction which could take it back toward $230 – $218 area before resuming higher again. However, until the stock manage to break above October peak, a double correction lower can still take place.
To have a better perspective about BIDU, we’ll switch to the monthly chart :
BIDU Monthly Chart 02.20.2018
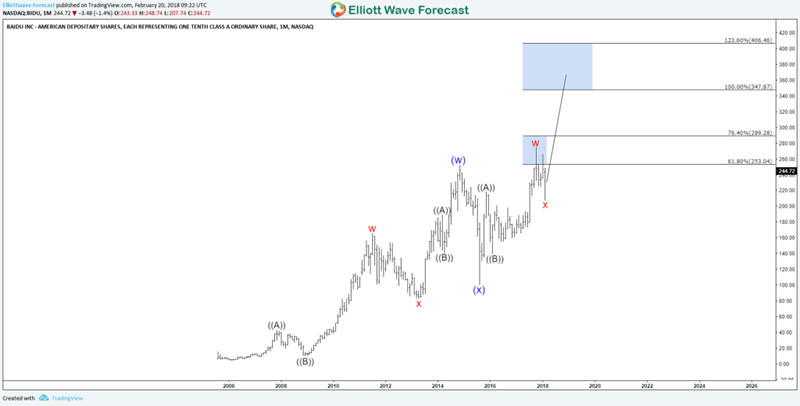
The Chinese giant Baidu, is showing an incomplete 5 swings bullish sequence from all time low which is different from the regular 5 waves move , as this advance is part of the double three 7 swings structure which suggest more upside toward the target at equal legs area $347 – $406.
BIDU seems to have already ended the 6th swing correction in red wave x and started the next leg higher. The move will support the rest of related technology stock and we expect the sector to see more upside in the coming years until BIDU achieve its target.
Consequently, after a break above October 2017 peak, BIDU will have a short term bullish sequence and we would favor buying the pullbacks in 3 , 7 or 11 swings whenever available.
If you want to learn more the new Elliott Wave Theory using our system then take this opportunity and try our services 14 days. You’ll learn how to trade Stocks and ETFs using our blue boxes and the 3, 7 or 11 swings sequence. You’ll also get access to our 78 instruments updated in 4 different time frames, Live Trading & Analysis Session done by our Expert Analysts every day, 24-hour chat room support and much more.
By Ayoub Ben Rejeb
https://elliottwave-forecast.com
ElliottWave-Forecast has built its reputation on accurate technical analysis and a winning attitude. By successfully incorporating the Elliott Wave Theory with Market Correlation, Cycles, Proprietary Pivot System, we provide precise forecasts with up-to-date analysis for 78 instruments including Forex, Commodities, Indices and a number of Stocks & ETFs from around the World. Our clients also have immediate access to our proprietary Actionable Trade Setups, Market Overview, 1 Hour, 4 Hour, Daily & Weekly Wave Counts. Live Screen Sharing Sessions, Daily Technical Videos, Elliott Wave Setup and Weekend videos .
Copyright © 2018 ElliottWave-Forecast - All Rights Reserved Disclaimer: The above is a matter of opinion provided for general information purposes only and is not intended as investment advice. Information and analysis above are derived from sources and utilising methods believed to be reliable, but we cannot accept responsibility for any losses you may incur as a result of this analysis. Individuals should consult with their personal financial advisors.
© 2005-2022 http://www.MarketOracle.co.uk - The Market Oracle is a FREE Daily Financial Markets Analysis & Forecasting online publication.