


Is the Malaysian Economy a Potemkin Village
Economics / Malaysia Apr 25, 2018 - 03:13 PM GMTBy: Sam_Chee_Kong

 Before we go on let's define what do you mean by Potemkin Village. As per Wikipedia definition,
“ In politics and economics, a Potemkin village (also Potyomkin village, derived from the Russian: потёмкинские деревни, Russian pronunciation: [pɐˈtʲɵmkʲɪnskʲɪɪ dʲɪˈrʲɛvnʲɪ] potyomkinskiye derevni) is any construction (literal or figurative) built solely to deceive others into thinking that a situation is better than it really is. The term comes from stories of a fake portable village built solely to impress Empress Catherine II by her former lover Grigory Potemkin during her journey to Crimea in 1787.”
To determine whether Malaysia's economy is really a potemkin village I will bring do a study bases
on the economic data for the past 10 years. I will look into the growth of GDP, money supply, corruption
index, inflation and other indicators as well.
The Malaysian economy has been growing between the range of -6 to 10 % per year for the past 10 years. This can be indicated by the graph below.
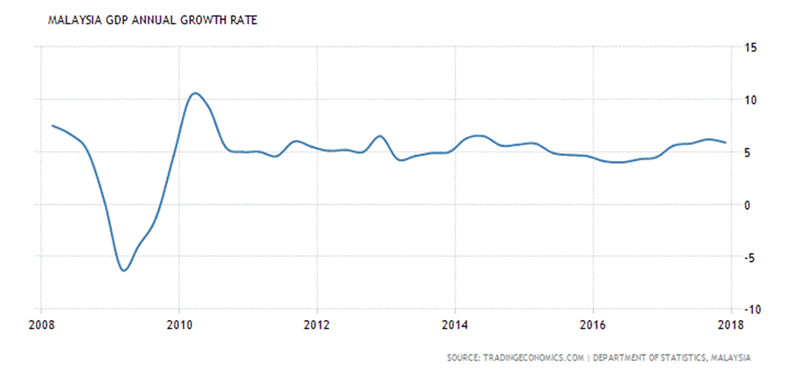
As can be seen from above the only period where it slacks off was during the Global Financial Crisis
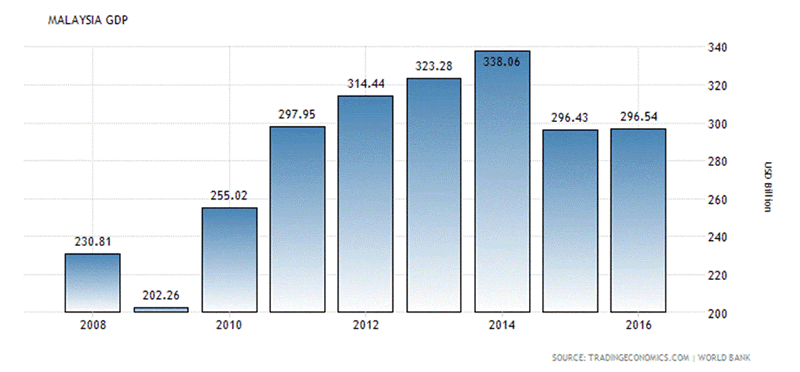
in 2008 where GDP growth is negative. The following chart below shows the Malaysian GDP in
terms of value (USD).
To a layman it may look impressive especially after the GFC in 2009 when it recorded a low of
USD 202.26 billion. It then surged towards a new high of USD 338.06 in 2014 which represents
an almost 70% growth. How can the Malaysian economy achieved such a great feat? If we
can remember, actually not only the Malaysian economy did well during this period but also
the rest of the world economy. After the Global Financial Crisis in 2009 the global economy and
financial markets are in tatters. Confidence and sentiments are at the bottom and something drastic
needed to be done in order to kick start the global economy again. Then comes the classic
Keynesian policy on pump priming the economy.
According to Keynesian theory during a crisis there is a lack of demand from consumers that
are due to the high interest rates which raises the cost of borrowing. This will then create a
liquidity trap which prohibits capital from flowing into the wider parts of the economy. Keynesian
economic policy rest on two pillars namely monetary easing or “Quantitative Easing” to end the
above liquidity trap and secondly fiscal spending to pump prime demand. As Paul Krugman, the
guru of Keynesian ideas said “lack of demand” is the fundamental problem of this crisis.
As a result we have the so called “Quantitative Easing” which was initiated by America and
soon adopted my other countries. This is because monetary easing will create a multiplier effect
on the economy. According to the Keynesian multiplier the output of an economy depends
on the input in terms of Government borrowing. Accordingly, if the multiplier is 2 then a
borrowing of $1 by the government will generate a $2 rise in output or GDP. This rest on the
premise that when Government borrow and spends it will ripples across the economy. Firstly,
those who got the Government contracts will spend more and hire more people at the same time.
At the same time the effects also rippled through the economy through those suppliers,
consultants, sub-contracters and so on. This is also called the “trickle down” effect. It is also
believed that during a stimulus, with lowering interest rates the multiplier effect should be at
least one while a fiscal contraction according to the IMF the multiplier effect is (–1.5 times).
Hence, now that we know during a stimulus by lowering interest rate it will create
a positive multiplier of at least 1 times. Let's take a look at the Malaysian economy since the Global
Financial Crisis in 2008. We first take a look at the money supply. The money supply of a country
corresponds to the monetary easing policy of the Government. See below.
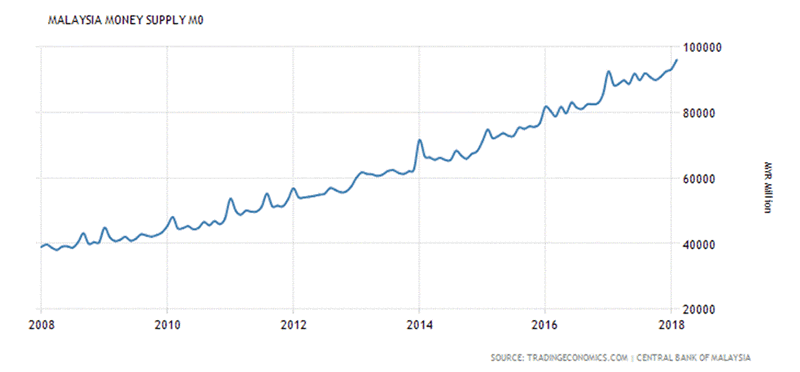
From the chart we can deduced that Malaysia's money supply has increased from about
RM 40000 million in 2008 to RM 96116 million in February 2018. almost 2.5 times. Such
massive increase in the money supply of a country will have repercussions on the economy
especially on inflation or price of goods and services. I will come back to this later on how
the Malaysian Government manipulate the calculation of inflation or CPI in order to produce a
low inflation rate.
The best metric to gauge it's effectiveness of Quantitative Easing is by using the multiplier effect of
economic growth. In normal circumstances with lowering interest and without leakages
a RM1 in debt incurred into the economy will create a RM 1 rise in GDP.
From above we know that the GDP in value terms has grown from 2008 (USD 230.81) to
USD 296.4. in 2016 or 28.%.
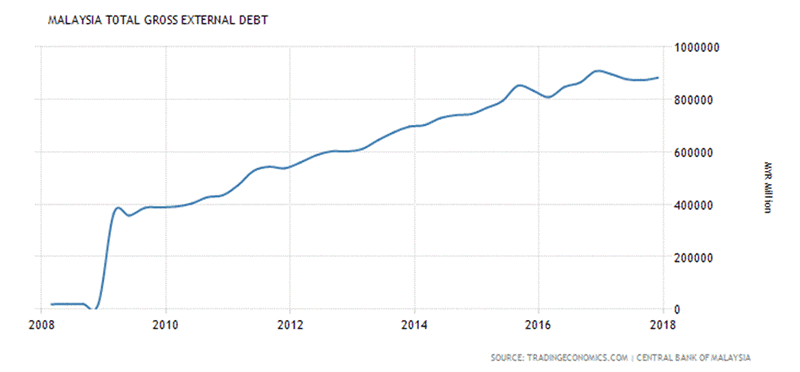
We proceed to look at the Malaysian Total External Debt.
From above our external debts has ballooned from RM 20316 million in 2008 to RM 910000 million
in December 2016. This is equivalent to an increase of 44.8 times.
It shows that to grow our GDP from USD 230.81 billion in 2008 to USD 296.54 in 2016
or 1.28 times, our government has incurred a massive amount of debts. The following I present
it in a graphical manner.
The summary is as follows.
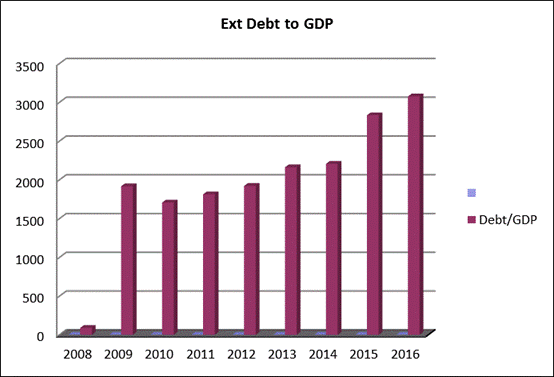
Thus, the above demonstrates that since 2009 our Government has been massively increasing our
external debt which continues today. In order to prevail the GDP annual growth rate of about 5 – 6%
we have build up more than RM 900 billion in external debts. Is it worth it?
If our economy has been well handled properly we wouldn't be in such a mess. We should be lowering
our debts not increasing it as in this case.
Hence, it be concluded that our Government has mis-allocated the precious capital to some
inefficient sectors of the economy. So what are the likely causes and effects arising from Quantitative
Easing?
1) Illicit Outflow of Funds
Another cause for the high level of debts that is needed to maintain the current rate of economic
growth is due some form of leakages in the economy. The economy is much
like anything else in nature which is also known as circular flow. The circular flow of income model
of an economy can be described as a money flow between consumers and businesses. In the
circular flow model consumers spend most of their money on goods and services while businesses
spend most of their income on wages and business expansion. From wikipedia. https://en.wikipedia.org/wiki/Circular_flow_of_income.
However there are certain activities that will cause “leakages” from the system. Consumers
normally do not spend all but save some money in the bank. Businesses also does not spend all
their income on wages or business expansion instead retain some earnings. Government too
helped contribute to the leakage through taxes which draws money out of the system. This is
achieved through income, property, import or any other form of taxes. Fortunately the
government also injects back some of the money collect into the economy through infrastructure
projects, pensions and cash handouts like our BR1M.
Hence, in order to preserve the present level of economic growth our Government makes
sure that the inflow of cash and leakages in the economy be balance. If not it will result in
what we called a budget deficit. This means our government is spending more than it receives.
If it is spending more then the difference will have to be plug by either borrowing money externally,
raising exports or encourage the inflow of Foreign Direct Investments. Unfortunately we have done
all of those but our External debts are still getting larger every year. Eventually, our government
will need more external debts in order to maintain our economic growth.
Another form of “leakage” that is causing greatdamage to our economy is the illicit outflow of funds
from our economy. First let me go through this foreign exchange reserve and balance of payment
conundrum first.
A country can only increase the size of its foreign reserve when it is running a balance of payment
surplus. What exactly is the Balance of Payments? To illustrate let me present you below with
the table of our balance of payment from 2009 to 2012 in summary form.
The balance of payment consist of three parts namely the Current Account, Capital Account
and the Statistical Discrepancies. The Current Account deals with the import and export of
goods and services. It records transaction arising from trade in goods and services, income accruing
and transfers of residents in one country to residents of another.
The Capital Account deals with the import and export of assets. It records the transactions related to international movement of financial assets. The Statistical Discrepancies or Error and Omissions deals with the problem of data accuracy and timing.
In practice the current account and capital account should balance. This is because any surplus in the current account should match the deficit in the capital account and vice versa. However sometimes
there might be some problems with the data due to delay and timing. To force the current and capital account to balance, statistical discrepancies is brought into the equation.
Or,
Current A/C + Capital A/C + Statistical Discrepancy = 0
However if you look deeper into our Balance of Payment above, you may find some irregularities in their classifications.
Firstly, we did not reduce our debts. As you can see from above, we are running balance of payment
surpluses in three out of the four years. There are two things a country will do when it run a
balance of payment surplus. One is to add on to its foreign reserves and the other is to retire
some of its debts. Malaysia obviously goes for the first option and that is to add to its reserves.
In 2010 our foreign reserves drop to RM 328,649 million because it has to absorb the RM 2,628 million
deficits.
Then in 2011 it soared to RM 423,331 million due to the budget surplus of RM 94,682 million
in 2011. Similarly, in 2012, it shot up to RM 427,204 million when we have a budget surplus of
RM 3,873 million. Why are we not reducing our debts or financing our Government expenditure with
the surplus? Why burden the people by reducing subsidies and increasing taxes (GST)?
Secondly, why such a huge Statistical Discrepancies? As you notice the main objective of the Statistical Discrepancies is to force balance the account due to the delay or accuracy of the respective accounts. Normally these are only minor adjustments and don’t run into tens of billions. If that’s the case then there are some serious problems with our data accuracy and hence suspicion. This may be due to large hidden capital outflows from Malaysia to other countries.
From 2009 till 2012 it totaled RM 168 billion. Whatever it is, I am certain that there isn't any Malaysian company that can afford to invest that much as Outward Foreign Direct Investment. Hence this explains why this item has a very large adjustment figure.
To explain it differently, there are people secretly diverting funds out of our country. The following chart shows the illicit funds flowing out from Malaysia by Global Integrity.
Year |
US$ (Bil) |
2001 |
13.1 |
2002 |
12.5 |
2003 |
17.8 |
2004 |
19.6 |
2005 |
28.1 |
2006 |
29.6 |
2007 |
32.5 |
2008 |
37.3 |
2009 |
30.4 |
2010 |
64.3 |
285.2 |
Source : Global Financial Integrity
As can be seen from the data derived from Global Financial Integrity, a U.S based financial watchdog, there has been a constant rise in illicit funds going out of Malaysia. The worst is during 2010 where
US$ 64.3 billion flowed out. As its name suggests ‘Discrepancy’, hence it is very difficult to keep track
of the financial transaction flows between our residents and foreigners.
- Corruption
Another source of leakage from our economy that is more lethal is corruption. It is normal business
for over billing, supplying lower grade materials and cutting corners during the course of an
infrastructure project. In the end the project might end up costing more than twice the original amount.
A very common practice is by issuing variation orders.
A variation order is a change or addition to an existing order. This may include alteration to design,
quantity or working conditions. Thus variation orders affects not only the cost of the project but
also the completion date as well. There has been many cases reported in the newspapers regarding
corruption ,collusion and dubious practices between the management and suppliers and contractors.
To prove it, Malaysia's corruption ranking by Transparency International put Malaysia at 62. Meaning
we are ranked 62 out of the 175 most corrupted countries. See below.
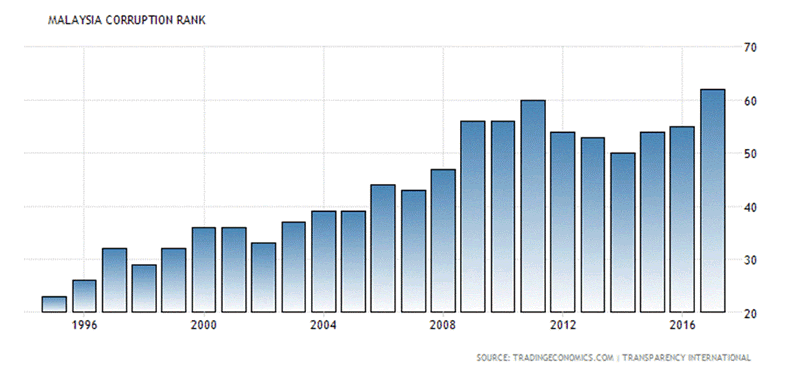
From above we know that our ranking had risen 7 places from 55 in 2016, A point to note is that the
ranking in 2007 was the worst since 1995. That's how bad things has gone down the drain for the
past 20 over years. What are the side effects of the above actions?
1) Inflation
Inflation is one of the side effect when any Government implements monetary easing. Down the road
the money supply will grow larger and in time there will be too much money chasing too few goods.
Inevitably it will cause a rise in the general prices of all goods and services. But wait a minute,
our Government says that our inflation rate is well under control. Our latest inflation rate is only 1.3%
as of March 2018. Is that right? See below.
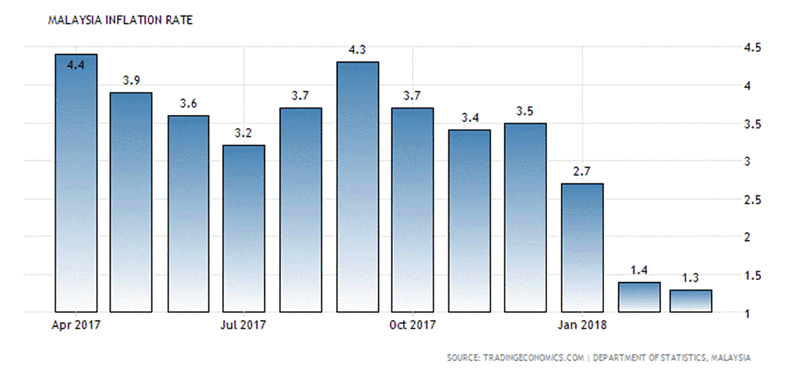
Given the massive monetary easing going on since 2009 as evidenced from the money supply
chart above. How can we sustain such a low inflation rate? The only way is to under reporting the
figures through the manipulation of statistics.
Inflation rate is measured by the The Consumer Price Index. It measures the movement of goods
and services purchased for consumption over a period of time. It is a very good measure for
people to evaluate purchasing power over time. As far as we know, since the introduction of GST
in 2015 prices of goods and services had risen so much and yet the government had been telling us
the contrary. This is because according to their calculation based on the CPI, the basket
of goods and services only went up by 2-3% per annum. So we know our government lied.
I shall briefly explain how the CPI can be manipulated. I have written a full comprehensive
article on how the Malaysian Government manipulates the CPI. It is a long article about 40 pages.
Here is the article.
http://www.marketoracle.co.uk/Article35613.html
In brief, Malaysia's CPI report is divided into 12 groupings which consists of about 400 itemized
goods and services.The following is the CPI table as released by the Department of Statistics
Malaysia with the weights assigned to each of the 12 groups. The full report are from this link.
http://www.statistics.gov.my/...
The 12 groupings and their respective weightings are as follows.
Items |
% |
Food |
30 |
Housing |
23 |
Transport |
15 |
Health |
1 |
Furnishing |
4 |
Clothing |
4 |
Alcoholic Drink |
2 |
Communications |
6 |
Recreation |
5 |
Education |
1 |
Restaurant & Hotel |
3 |
Misc Good & Serv |
6 |
Total |
100 |
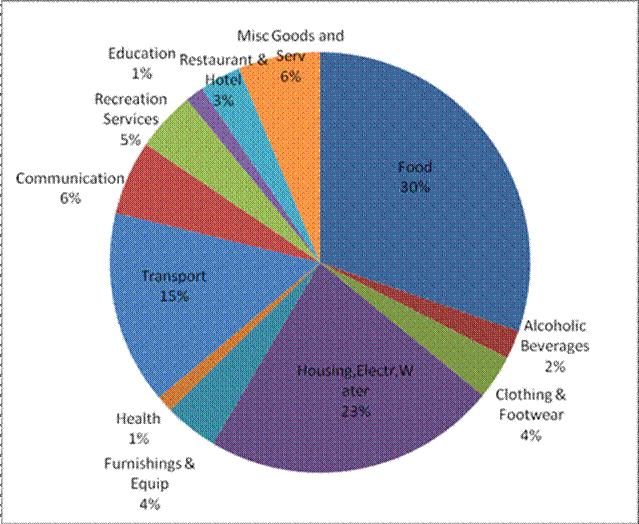
From the above we know the weightings assigned for the different groups.
Listed below are the flaws in the calculation of the CPI.
a) Food accounted for too much weighting in the CPI
Based on the above Table, the Food and Non Alcoholic grouping accounts for 30.3% of the total CPI
weighting. This can be quite considerable when we compare it with the rest of the world. The following
chart is the for the food component as a percentage of the CPI for 25 countries around the world.
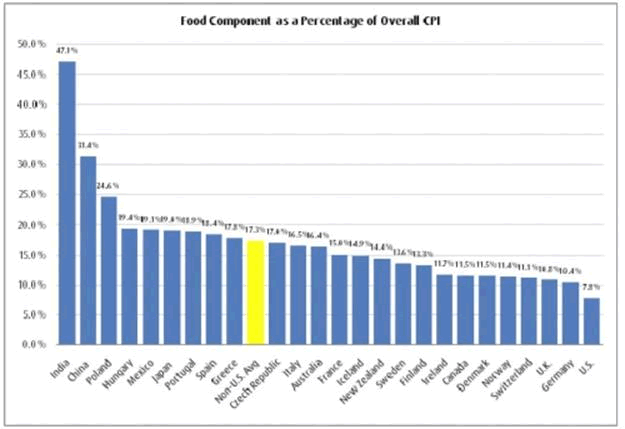
As you can see from the chart above when you take out the countries at both the head and tail end
of the spectrum (India – 47.1% and US 7.8%) then the statistical bias will be reduced and it will
provide a more accurate picture. After the adjustment the mean for Food Component of CPI in the
23 countries is about 17.3%. So Malaysia’s 30.3% food weighting in the CPI can be considered on the
high end of the table after China’s 31.4%. The question is whether our 30.3% of the food component
actually reflect the price rise in the CPI.
From Malaysia’s CPI table the price difference in the food component from Jan 2011 to Jan 2012
only recorded a mere 4.8% increase. But according to FAO (Food And Agriculture) Organization of the
United Nations, the price of basic food necessities around the world have increased by 28% for the
past year. So can we conclude that it is due to Malaysia’s ability to managed its food production
much better than the rest of the world or the FAO’s figure is inaccurate?
b) bias in Housing,Water,Electricity,Gas and other Fuels.
If we look into the breakdown of the Grouping you can see most of the weighting goes to
‘Rental for Housing’ which was allocated a lion share of 17.24% out of the 22.59% or 76%.
Electricity, Gas and other Fuels only take up 3.34% while the Water Supply share is 1.34%.
Heck, since when rental is more important than Electricity and Gas in our daily expenses?
By putting less importance to Electricity and Gas and Other Fuels in the ‘Energy Grouping’
any price increase by the Government in Fuel and Electricity ‘will only have minimal impact’
on the overall grouping and hence the calculation of the CPI figure.
Even with the rising of energy prices, it will have a less profound effect on the CPI
because Electricity and Gas only takes up about 3.34% of the average Malaysian consumer
expenditure.
c) Health Group weighting is too low
Health expenses only accounted for 1.3% in the weightage of the CPI? The average income
of a Malaysian household is about RM 14,016 per annum according to the Household Income Survey
done in 2009. So based on the above statistics the average Malaysian household can only spend about
RM 182 per annum (1.3% x RM14,016) on health expenses. Does this seem logical since health care
cost has been ever rising for the past years?
d) Education – Flawed in weightings
As for Education, it only accounted for 1.41% of the total. We believe that education in grossly under
represented as the cost of education had going up in double digits especially in the tertiary level.
How can Education is given only 1.41% in weighting since it is one of the biggest investment for
parents today? Thus any big increase in education fees are not accounted for in the CPI calculation.
e) Restaurants and Hotels
Since our expenditure in Restaurants and Cafes take up quite a big chunk of our income when we eat
out (unless you stay at home and cook), we feel that the weight of ,2% that is assigned to Expenditure
in Restaurants and Cafes is too low. As we all know eating out has always been getting more expensive
these days. We feel that a higher weighting should be assign to this grouping (something like 8-10%)
to reflect the changes in our lifestyles nowadays where people prefer to eat out than to cook at home.
In summary, the above are some methods that our government used to manipulate the CPI data
so as to report a much lower inflation rate.
- Ringgit Depreciation
Unfortunately, all of the above actions have an effect on our exchange rate. As with the prices
of goods and services they are determined by the supply and demand. This works the same with
the exchange rate. When there is more demand for Ringgit it will appreciate and vice versa. When our
Government increases the money supply it will create a situation where there is an oversupply of
Ringgit and will put pressure on the Ringgit exchange rate.
Similarly when there is a leakage in the economy there will be outflow of funds from our economy.
Those funds are normally in USD and hence which means people are selling Ringgit to buy USD.
This will again create another hugh supply of Ringgit.
The following is the chart of our Ringgit against the USD.
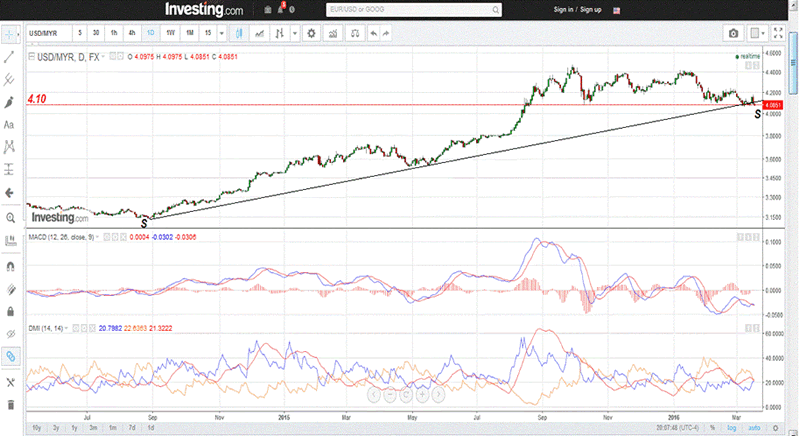
As can be seen from above the Ringgit depreciated from 3.10 in 2016 to a low of 4.5 in 2017.
As of late the Ringgit recovered slightly to 3.9 to the USD. I reckon this would not hold because I
reckon this is a false recovery because it does accompanied by any significant economic recovery. I
reckon the Ringgit has been artificially propped up due to the following.
a) Bank Negara Malaysia intervention into the foreign exchange market by selling USD and
buying Ringgit. This creates a sense of false demand for the Ringgit. See the chart below.
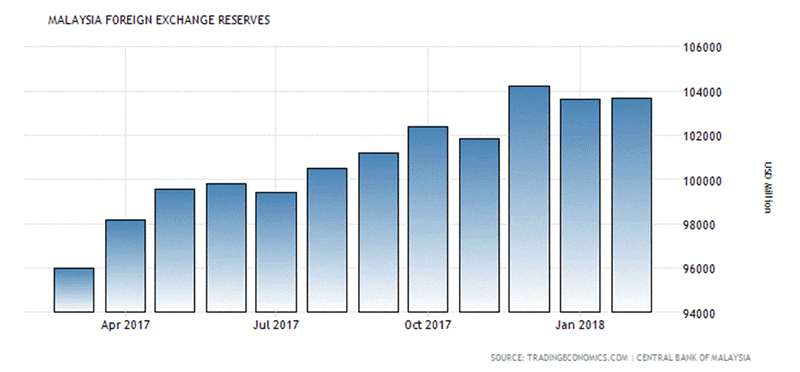
For the past three months there is drop in our foreign exchange reserves. This is especially evident
in the month of January.
b) Upward revision of our interest rates by 25 basis points.
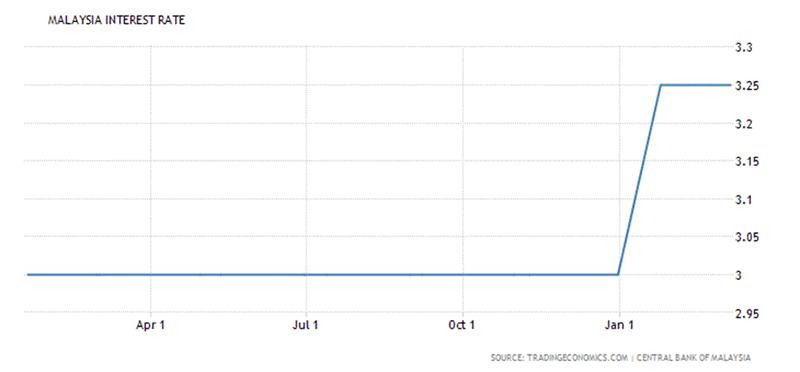
From above you can see that in January there is an increase in the interest rate by 25 basis points. An
upward revision in the interest rate helps attract more foreign capital into the country. This in turn is
a positive as foreign investors will bring along USD which will then be converted to Ringgit.
Thus with the combined effort of currency intervention and upward revision of the interest rate helped
makes the Ringgit stronger.
In summary,Malaysia's economy has already been a Potemkin Village since 2009 when it started
Quantitative Easing. Since then it was trapped in the circular flow of debt whereby it's economy
cannot grow without any injection of capital. In the next few years it's external debt will top
the RM 1 trillion mark. By then I hope it is too late to ask how is Malaysia going to repay the
RM 1 trillion debt?
by Sam Chee Kong
cheekongsam@yahoo.com
© 2018 Copyright Sam Chee Kong - All Rights Reserved
Disclaimer: The above is a matter of opinion provided for general information purposes only and is not intended as investment advice. Information and analysis above are derived from sources and utilising methods believed to be reliable, but we cannot accept responsibility for any losses you may incur as a result of this analysis. Individuals should consult with their personal financial advisors.
© 2005-2022 http://www.MarketOracle.co.uk - The Market Oracle is a FREE Daily Financial Markets Analysis & Forecasting online publication.