Value of Housing Markets in USA and UK Past, Present, and Future
Housing-Market / US Housing Sep 13, 2008 - 11:47 AM GMTBy: Andrew_Butter
 The nationalization of Fannie and Freddie signaled that the valuations of assets used to secure loans to which these companies were exposed, were suspect.
"Legally" Fannie and Freddie were solvent. But no one believed the valuations, first the market didn't, and finally, neither did the regulators. This was an extraordinary admission of failure of the system of valuation, past and present.
What is Value?
Price is what someone paid previously for an asset (or sometimes what they want to be paid). Value is something else, properly defined it's an opinion about the price of a transaction that might happen in the future.
"Fair Value" as it is used by accountants is a misnomer. It is typically defined as the estimate of a price of a transaction that might have happened in the past (typically on the date of the audit). It is not hard to find out the price in history from comparing with other transactions about that time and it can be audited and re-visited if necessary, a less confusing term would be "Fair Price".
Value or more correctly if the definition of International Valuation Standards (IVS) is used, Market Value, is simply an opinion or an estimate that cannot always be audited because often it is in the future.
"Fair Value" is a useful concept for doing accounts, but it has limitations when used for assessing capital adequacy or prudent Loan to Value Ratios.
From early 2000 the IMF, the World Bank and the International Valuation Standards Committee (IVSC) warned that valuations used to assess capital adequacy were "seriously flawed" and "bound to be misleading" (for example in a letter from IVSC to the Bank of International Settlements dated 30th July 2003 - (this is on the BIS website)).
These objections were ignored by both BIS and the US and UK banking regulators, who opted to start to introduce "Fair Value Accounting" as the basis for assessing capital adequacy.
The problem with "Fair Value" is that it says nothing about what assets might be worth (i.e. their likely price), in the future. Yet that is precisely the number that needs to be estimated if there is to be a prudent assessment of provisions for expenditure that might have to be made in the future to cover exposure on bad loans.
The other problem with "Fair Value" is that it can change rapidly in periods of market disequilibrium. The result is that performing loans can drag down capital adequacy, even if they pose absolutely no risk.
International Valuation Standards provide an elegant solution to this problem. They explicitly acknowledge that markets can be in disequilibrium, and specify that in such cases an Other Than Market Value that reflects the long-term equilibrium value can be considered, for example when assessing capital adequacy, rather than the "value on the day" (i.e. Fair Value).
This has two advantages:
• Markets are sometimes over-priced.
It is widely acknowledged that in the recent past, housing was over-priced in USA and in UK . Indeed as early as 2003 the IMF warned that this was the case, as did Professor Shiller and others in 2005.. By definition the equilibrium value would have been less than the "Market Price" or "Fair Value" at such a time.
The fact that "Fair Value" or a variant of this was used to assess capital adequacy at this time may have resulted in a false sense of security. More damaging, this false sense of security allowed more lending, which in turn drove up prices, and this improved capital adequacy of mortgage providers and the risk profile of guarantors of mortgages, in a self-perpetuating cycle.
If the "equilibrium value" (or Other than Market Value) had been used to estimate the value of assets, the Loan to Value ratios that would have been allowed, would have been significantly less than what was in effect the "Loan to Price". Apart from putting a brake on imprudent lending, thus pushing the market back down towards the equilibrium, this would have meant that the loans that failed were secured by assets with a value at the time of failure, of a similar magnitude to the exposure.
The difference between historical "Fair Price" and "value" can be significant, for example in this instance by $500 billion, or more. That's the "value" of doing valuations properly.
• Markets are sometimes under-priced
There is a faction currently that believes that declining house prices are due to nothing more than the shortage of credit for mortgages. i.e. that prices are now below the equilibrium.
If this is true, then using "equilibrium value" instead of "Fair Value" or "Price" would encourage lending, pushing the price back up towards equilibrium.
Reliance on value as defined by IVS would have, and would in the future, stabilize the market.
The evidence of the recent past, both in terms of the magnitude of the losses and the general uncertainty and mistrust in the financial services industry, suggests that reliance on Fair Value was, and is, destabilizing.
What is equilibrium value?
Technically there is no such thing as "equilibrium value" under IVS, the expression is used here simply as a way of explaining valuation concepts for those not familiar with the subject.
Under IVS every valuation should consider three approaches to valuation, of which only two are relevant in this instance.
One is called the sales comparison approach. This has no predictive component, you just compare prices in the market and that's the answer. That's the preferred way to work out the accountant's term "Fair Value" or "Mark to Market" and for housing as a whole that's what is used for the S&P Case-Shiller Index in UK and for example the Nationwide Index in UK.
The other way is an income capitalization valuation which by definition is more or less immune to market speculation or disequilibrium. This does have a certain, if limited, predictive component and it has a longer "shelf life".
By definition (at least under IVS) when the two valuation approaches give the same answer the market is in equilibrium. This is in effect the definition of "equilibrium value" as it is used here. Turn that around and that means the equilibrium is the income capitalization valuation; since only the sales comparison method is affected by speculation and imprudent lending (on the up-side) or by negative market sentiment or atypical constraints on lending (on the down-side).
An un-spoken assumption is that markets are on average in equilibrium over a long period of time, therefore the equilibrium as defined here is the value around which prices fluctuate and by definition, the amplitude of fluctuation above equilibrium is, over time, in aggregate, exactly equal to the amplitude below equilibrium.
So what is the equilibrium?
The problem with doing an income capitalization valuation for housing (for people unfamiliar with valuation procedures) is that you need to know the income (of the house) and the yield, and in a proper valuation these must be "market derived".
It is hard to estimate how much money an owner-occupier "pays" for living in his own house (i.e. (mainly) the cost of capital employed), or what is the yield that should properly be attributed to that "income" from which value can be estimated.
Hard but not impossible.
It is too complicated to explain how in a (fairly) short essay such as this one. But the point here is "what" not "why".
Suffice to say that the income capitalization valuation of all housing in USA and UK (i.e. the equilibrium value) is exactly equal to:
Equilibrium Average House Price = GDP per house x ƒ (1/LTIR 5 )
Where:
House Price = In USA the database from the website of Professor
Shiller, in UK the Nationwide House Price Index 1 .
GDP per House = GDP per house (all houses, vacant, rented, second
homes, holiday home).
ƒ(1/LTIR 5 ) = A cumulative normal distribution function of the
average of Long Term Interest Rates for the past five years (i.e. an "S" curve (Fig [1])).
If prices and GDP per house are indexed so that the year 2000 is equal to 100 (so that USA and UK can be compared), ƒ(1/LTIR 5 ) ranges from about 1.10 (for interest rates of 5%) up to 1.50 (for interest rates of 2.5%).
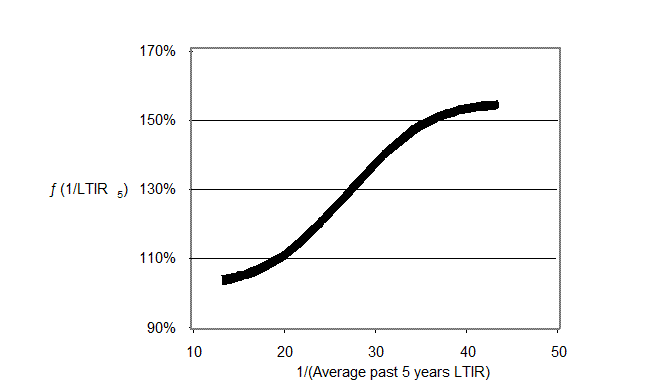
Fig 1: Effect of Interest rates on equilibrium value (USA 1929 to 2008 and UK 1971 to 2008).
1 Notes:
Professor Shiller's numbers for house prices which he generously provides on his website, do not exactly agree with the S&P Case-Shiller database (i.e. the Composite 20 City timeline). However the "Shiller" data is a very long time series and for this reason these data were used for the analysis. By 2007 the "Shiller" data was 8% lower than the S&P Case-Shiller data (this is referred to later in the essay). The Nationwide Index is one of many house price indexes for UK , none of which agree, although there is a good correlation between this database and the " Halifax " database. A discussion of house prices and the quantum of change of course depends on which database is referenced. Notwithstanding most databases correlate reasonably well over the long term.
How well does this valuation model work?
The valuation model shown above is the product of a measure of expenditure (i.e. the income of housing), divided by an expression for yield, and every component of the model is market derived from independent variables, thus the model is an income capitalization valuation.
However, this is not a well-known method for doing such a valuation (in fact it is quite possible that this is the first time anyone has ever used this approach in a valuation).
Notwithstanding IVS provides a wide degree of latitude for how valuations can be done, so long as (a) data is market-derived (b) sufficient data is used (c) the data is properly analyzed, or in other words, the acid test of a valuation model is simply, does it work?
The test for whether the model works or not, is that if it does, then the result should be exactly equal to the sales comparison valuation, on average, over a long period of time.
A plot of this valuation model compared to house prices (i.e. S&P Case-Shiller Index in USA and Nationwide in UK ) gives:
• A correlation (R-Squared) of 98.83% for USA from 1929 to 2001 (the start of the current departure from equilibrium which is not over).
• A correlation of 94.1% for UK from 1971 to 2001.
• Together, i.e. for 102 years of data (indexed so that USA and UK can be compared) the correlation is 97.78%.
• 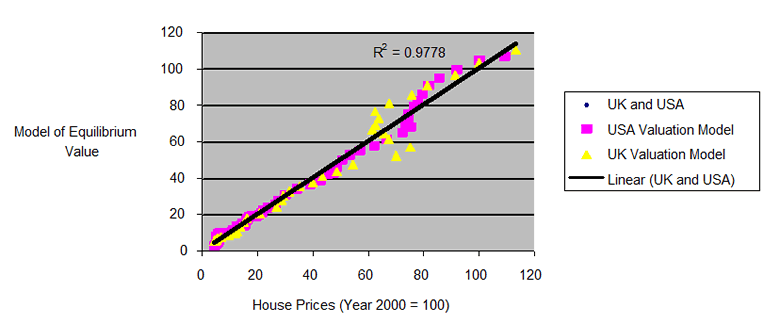
The Standard Error is 1.2% as a whole and 5% on the ratio of house prices to the income capitalization valuation for periods when the market was broadly in equilibrium.
Fig 2: Solutions to the valuation model compared to actual USA 1929 to 2001, UK 1971 to 2001.
In plain English that means that the valuation model works. Or in other words it is a reliable methodology for valuing housing as a whole using an income capitalization approach that strictly conforms to International Valuation Standards.
So much for the past - how about the future?
GDP, long term interest rates, and housing starts are fairly predictable, and there are plenty of predictions around. If you have a reasonable fix on these numbers it is possible to predict where the equilibrium will be (more or less) in the future.
That doesn't of course say anything about whether or not the market will be in equilibrium in the future.
But one thing is certain, if the equilibrium of the past carries on in the future, prices will by definition oscillate around the equilibrium.
So even though the model says nothing about what the price will be on a particular day, it reliably predicts what the price will be on average.
As it turns out that the oscillations are rather predictable, at least they were in the past:
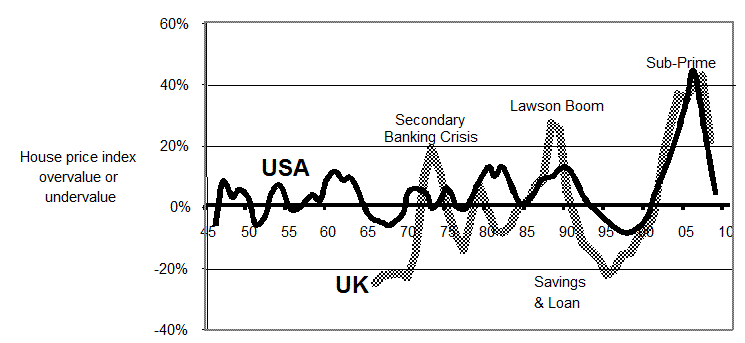
Fig 3: House prices as % of equilibrium 1946 to 2008. Note 2008 trended for whole year from GDP, Long Term Interest Rates and house price index up to May 2008.
Note: Although the "Shiller" database was used as a basis for the model, the S&P Case Shiller data was used for this comparison from 2000 to 2008. If the Shiller data is used the "over-pricing" of the US housing market in 2006 is 33% rather than 44% as is shown in this example.
It is perhaps significant that the model picks up the periods of imprudent lending and the hangovers that inevitably follow, rather accurately.
Some pointers from this chart are as follows:
• The valuation model says that USA house prices in June 2008 were about 5% above equilibrium; UK prices are about 17% above. That's the valuation opinion of this writer, done strictly in accordance with IVS. Theoretically anyone "skilled in the art" who did a valuation using IVS should reach a similar conclusion.
• The reason there was a 200% increase in prices from about 1995 in USA and a 300% increase in UK , was only partially due to imprudent lending. By this model in 2001 the market was in equilibrium.
• If the pattern of oscillations continues then it looks likely that the amplitude of the previous over-pricing will be a reasonably good predictor of the amplitude of future under-pricing. That makes some sort of sense, logically there has to be some mechanism to shake over-priced assets out of the tree.
In fact the under-pricing is typically 80% of the preceding cycle of over-pricing. (this is the average if you take the S&L, the Lawson Boom and the Secondary Banking Crisis). A possible explanation for this is perhaps that governments like housing to be over-priced because it is "popular", and the "equity withdrawals" pump up consumer spending. By the same token governments appear to be broadly disposed to throw taxpayers' money at incompetent mortgage providers to keep house prices from falling. In other words, manipulation of the market appears historically to have been more on the downside, than on the upside.
• The frequency and amplitude of oscillations appear to be increasing, over time. This may possibly be because the system of regulation is becoming less rather than more effective (this is addressed in more detail below).
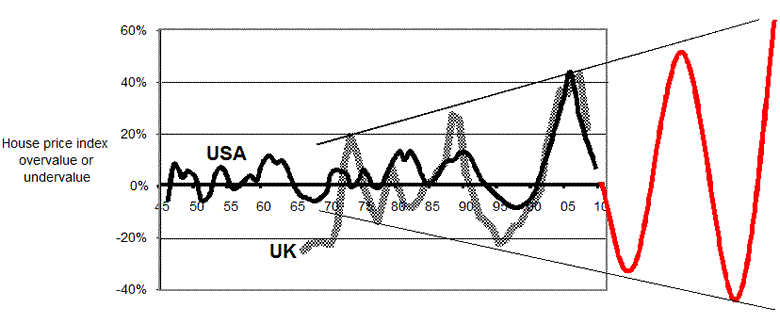
So trend-line it would appear likely that the down-cycle following the sub-prime will be 80% of the up-cycle which peaked at 44% for both UK and USA and the future might perhaps look something like:
Fig 4: Projection of over/under value into the future assuming past trends are repeated.
If history repeats itself it would therefore appear "reasonable" (that's a valuation expression) to expect that within a few years house prices in both UK and USA will end up 44% x 80% = 35% or so below the long-term equilibrium line.
And also, if history repeats itself, the duration of the slump (i.e. the time that the price is below the equilibrium) will be of a similar time period to the period of over-pricing.
According to this model, what that will mean in terms of actual (nominal) house prices will depend on only two things:
• Nominal GDP growth (how you account for inflation or the clever tricks you use to "make it disappear" are irrelevant - nominal GDP is a hard number, and it is checked three ways (expenditure, income and capital formation), what's "soft" is how much of that was "real")).
• Long Term Interest Rates.
Increases in the number of houses is largely irrelevant in the current range (less than 2% a year).
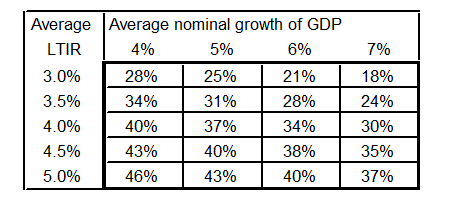
If therefore it is assumed that the most reasonable projection for the size, amplitude, and duration of the current slump in house prices is the size and duration of the preceding up-cycle with a peak 35% "under-pricing" then solving the model predicts the following "peak to trough" of the current slump, for various assumptions for GDP growth and long term interest rates:
Fig 4: Prediction of "bottom" (peak to trough in house price index) of
US and UK housing market following sub-prime; assumes preceding
upside peak was 44% above equilibrium, model starts Jan 2008.
The accuracy of the "prediction"
Outside of the accuracy of the "prediction" of GDP and LTIR for 2008 and the next one to three years the main uncertainty in this model is how far prices were above the equilibrium.
As noted above there is a discrepancy between the data on Professor Shiller's website (it is reasonable to assume that this is the most reliable source of data that exists), and the index reported on the S&P Case-Shiller website. The difference between the two translates to an 8% difference in the "peak" in July 2006 from 44% to 36%.
The Nationwide Index is also not necessarily the most accurate marker that exists, there are other indexes which report lower levels of fluctuation.
If, for example Shiller's numbers were right for 2006 and thee Nationwide numbers were too high in 200, and the peak over-pricing had been 36% in USA or UK then (if history repeats) the peak of the trough would likely be 80% x 36% = 29%, and the matrix for "peak to trough" would be:
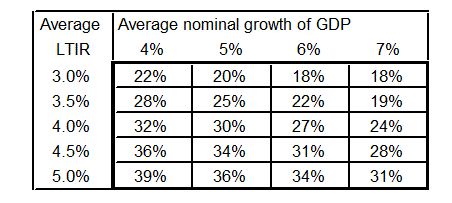
Fig 5: Prediction of "bottom" (peak-to-trough in house price index) of
US and UK housing market following sub-prime.; assumes preceding
upside peak was 36% above equilibrium. Model starts Jan 2008.
Discussion
So far peak to June 2008 in USA was 18% down on July 2006.
• So if the previous peak was 44%, nominal GDP growth averages 6% and LTIR averages 4.0% USA is about half way there, and the bottom predicted from the matrix will be 34% peak-to-trough (in about 2012). That would mean another 20% from the current level until the bottom. That's probably worst case.
• For the same assumptions for GDP and LTIR and a 36% preceding peak, peak-to-trough for USA will be 27%, indicating another 10% from current levels to the bottom.
It is possible that nominal GDP growth in 2008 will turn out in reality (mainly due to inflation) to be as much as 7% or perhaps more. If so, given that LTIR are 3.7% then it is possible that house prices are close to bottoming in USA .
Either way the model suggests that insofar as mitigating the pain it looks like the decision of the US Fed to radically cut interest rates and stimulate economic growth, ignoring inflation, was absolutely the right thing to do, if "rescuing" the housing market was the objective (and it's only that which will make the outstanding problem loans good).
The UK appears to be behind the curve in more than one respect. They are keeping interest rates relatively high (a) running the risk of propelling their economy into recession (b) running the risk of prolonging and intensifying the agony. This model suggests that given the slower GDP growth and slightly higher interest rates (say 5% nominal growth and 4.5% long term interest rates) the peak to trough could end up in the range 34% to 40% in total with a bottom in 2013. This works out at 25% to 30% down in price from current levels, unless the government cuts interest rates radically and stimulates the economy.
Is this inevitable?
None of this is inevitable.
It is "reasonable" to suppose that the current mess was caused by defects in the system of regulation that were destabilizing and directly resulted in market inefficiencies. If so, and if "innovations" and sleepy regulators caused this mess, there ought to be "innovations" to cure it.
It is likely that the recent inflation in house prices in USA and UK was due to two things:
• As Mike Shedlock pointed out (Market Oracle 03 Sept 2008), the way CPI is calculated in USA is suspect (some might say idiotic), it's the same story in UK .
If house price inflation had been recognized in the CPI (as it was until they changed the method of calculation in 1987), even the most sleepy regulators would not have allowed people to borrow money at those rates, or in those quantities.
This would have put an early brake on the unsustainable house price inflation that followed, which allowed people to borrow at 6% or less and make 12% with a net IRR on equity sometimes in excess of 25%. No wonder everyone in America jumped onto the bandwagon, it was easier money that operating a crack-cocaine franchise on Chicago South Side, and even better (a) legal and (b) non-recourse, like going into a casino, borrowing a stake and, not having to pay the stake back if you lose.
Bringing back the "old way" of estimating inflation in respect of "shelter" would help stabilize house prices towards the equilibrium line, both above and below.
If house prices are falling 10% a year, there is plenty of scope to ratchet down interest rates without creating a net increase in inflation. The US Fed seems to have understood some or all of this; the UK hasn't, and if they don't get their heads around this simple point their pain will be much more intense and longer lasting.
• As explained above, since early 2000 the IMF, the World Bank and IVSC warned that valuations used to assess capital adequacy were "seriously flawed" and "bound to be misleading" . Not that anyone paid any attention, in early 2007 in response to the sub-prime crisis, BIS initiated a project to "gain a deeper understanding of valuations" with the mandate of "recognizing the critical importance of sound valuations to risk management and regulatory capital adequacy".
IVSC was not invited to participate in this project and the resulting report issued in June 2008 focused only on "Fair Value" as defined under International Financial Reporting Standards (IFRS) and US Generally Accepted Accounting Principles (US GAAP). The IVS benchmarks of "Market Value" and the concept of "Other Than Market Value" were not considered (all on the BIS website).
The new accounting rules that use "Fair Value" and "Mark to Market" may be great for accountants, but they are a seriously dumb way to assess capital adequacy. That's the whole point of what IVSC, the IMF and the World Bank were going on about. It wasn't smart to ignore them then, and it is still not smart.
Recognizing IVS and implementing this valuation standard would stabilize the housing market and bring prices towards the equilibrium, both above and below. This would also mean that interest rates could be set in response to the wider needs of the economy since the amount of lending to the housing market could be completely controlled via the instrument of capital adequacy.
In which case interest rates could be set without any regard for the need to bail out negative-equity homeowners unfortunate enough to have borrowed more money than they should have, and the lunatic bankers who loaned them this money.
If IVS was recognized, "history" would not have to repeat itself, US house prices would not have to fall by more than another 5% before turning and UK prices would not have to fall by more than 15% before turning.
The downside of doing this would be that thereafter, housing would become a rather boring affair, no booms and no busts, just places for people to live.
Imagine that, where would be the fun?
Ordinary people could have houses they could afford, and investment bankers would have to go back to doing mortgage backed securities (MBS's) for municipal sewage systems, which arguably is where they rightfully belong.
Investment opportunities
When markets are inefficient, both above and below the equilibrium, there are opportunities. If no one is sure about the "valuations", value can be found.
If you know the value then you are the one-eyed man.
If you believe the US Fed will keep interest rates low and that this will get reflected in long term rates, and if you believe that the recent surge in US exports and the GDP growth that this produced is not a flash in the pan, then this might be a good time to think about buying up distressed real estate assets in USA.
If you believe that the regulators are dumb enough to persist with using "Fair Value" and "Mark to Market" to assess capital adequacy, then (a) caution is advised, but (b) there is no reason why there shouldn't be a 400% rise in house prices from 2013 to 2018.
Just remember to get out in time, the cycle will be shorter (Fig 5) - the bail out point is when the rate of growth of house prices crosses the ratio of price to equilibrium.
The danger for the bottom-fisher is of course that prices won't bounce. Or in the succinct words of one commentator (I lost his name, but it was a good line) "real estate doesn't bounce, it goes "splat ". That's what happened after the housing slump in Japan and after the Lawson Boom in UK , and a lot of early-bird bottom-fishers lost their bait.
It's all about time, Fair Value is about history, Value is about the future, and timing of course, as always, is everything.
By Andrew Butler
Andrew Butter is managing partner of ABMC, an investment advisory firm, based in Dubai ( hbutter@eim.ae ), that he setup in 1999, and is has been involved advising on large scale real estate investments, mainly in Dubai.
Andrew Butter Archive |
© 2005-2022 http://www.MarketOracle.co.uk - The Market Oracle is a FREE Daily Financial Markets Analysis & Forecasting online publication.


