


Next Recession: Turning Zero Percent Interest Rates Into A 21% Yield
Interest-Rates / US Interest Rates Feb 28, 2019 - 06:14 PM GMTBy: Dan_Amerman

 If there is a new recession in the next few years, then it is highly likely that the Federal Reserve will take extreme measures in response, with the primary response being to swiftly knock short term interest rates back down to zero percent.
For many investors - the combination of recession, heavy-handed Fed interventions, and the return of zero percent interest rate policies (ZIRP) is likely to produce devastating results for their portfolios, and possibly their standard of living in retirement.
At the same time - some quite attractive profit opportunities will also exist, once we learn how to see them. This analysis explores one reasonably simple and practical alternative for turning zero percent interest rates into a 21% annual return.
This analysis is part of a series of related analyses, an overview of the rest of the series is linked here.
Turning Heavy-Handed Fed Interventions Into Cash
Many people fear that another recession could be on the way. As covered in previous analyses, we have a number of indicators are now warning of a possible 35th iteration of the business cycle (since 1854) - and a 35th recession - within the next one to two years.
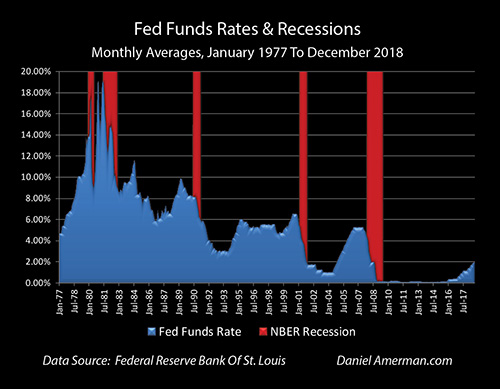
As shown in the graphic above, which is developed in a previous analysis linked here, we have a long history of how the Federal Reserve has responded to recessions. The red areas are the five recessions over the last 40 years, and as can be seen with the blue areas - Fed Funds rates plunge every time there is a recession.
This perfect correlation is not coincidence, but policy. Slashing interest rates is the primary tool that the Fed uses to try to jolt the economy out of recession. Because interest rates started at such a low level going into the 2007 recession, following this policy was why rates were forced to the extraordinary place of zero percent for what would end up being seven years afterwards.
It is visually obvious just how low the top of the blue area currently is, when compared to the starting points with the previous five iterations of the business cycle. With the Fed having possibly paused its cycle of increasing interest rates, this rate level or something only moderately higher may be the starting "peak" before a potential new recession.
So, if a recession does hit within the next one to two years then, as developed in previous analyses (and as can also be determined by studying the minutes for Federal Open Market Committee meetings) the almost certain response of the Fed will be to slam interest rates straight back down to zero percent.
That combination of recession and a return to zero percent interest rates would create financial hardships for many millions of people while likely dramatically changing prices and returns in virtually all investment markets, including 1) bonds, 2) stocks, 3) real estate and 4) precious metals.
It would also create some unusually good profit opportunities - that can be identified in advance.
We will start with a particularly simple investment - the 10 year U.S. Treasury bond - and use it to practically illustrate one real world investment strategy, with much broader implications.
Core Valuation Of Cash Flows
The core principle that underlies almost all securities pricing is that of profits and the time value of money. We spend money now, and we get money back in the future. How much money we get back and when we get it back - relative to what we put in - is what determines our profits and our return on investment
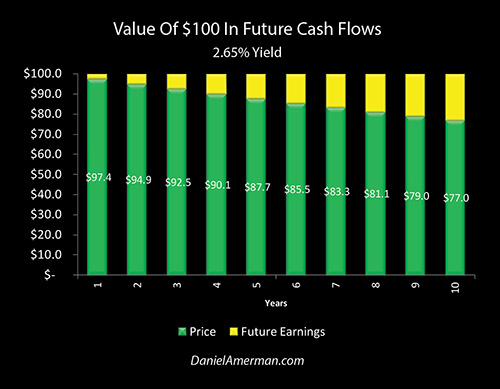
The graph above shows how much $100 in the future is worth today, for years 1 to 10 and at a 2.65% yield. The 2.65% yield is not random, but is the approximate yield on 10 year U.S. Treasury bonds at the time this analysis was originally prepared.
As we look at the graph, the green area is the price we pay today for the $100 cash flow (i.e. the present value), and the yellow area is the profits - the future cash that is in excess of what we paid today. If we look one year out, then we pay $97.40, and we get that back plus an extra $2.60, which is our reward for the investment.
If we look out five years, then we pay $87.70 for the rights to that $100 in future cash flow, meaning that we will receive $12.30 in earnings. The farther we go out in time, then the greater the eventual rewards, as shown with the increasing heights of the yellow bars. If we buy $100 in cash flow ten years from now at a 2.65% yield, then we are paying $77 today, and we will get that back plus another $23 in earnings.
Playing The Fed For Profit
Now let's get back to the Federal Reserve being trapped in an interest-rate box, because it isn't starting with sufficiently high interest rates if a new recession hits or is imminent. The Fed would slam interest rates down in response to recession - and we know this with a very high degree of confidence. This radical reduction in interest rates would be very bad news for a lot of people, and this is particularly true for savers or retirees who will be depending on interest income in retirement.
At the same time, the Fed is materially changing the value of each of our 10 annual cash flows. For this illustration, we're going to assume that the 10 year yield does not go down to zero percent along with the Fed Funds rate, but that it does move down to 0.5%.
That is a lower level than what was reached in 2008 in the last iteration, but the Fed is also likely starting from a much lower interest rate level, which is a huge problem. Very briefly, one way of overcoming this is expanded quantitative easing, as explored in the analysis linked here. Another alternative could be negative interest rates, such as those that have been used in Europe and Japan. Either path could lead to materially lower 10 year Treasury yields, and this could potentially happen on a more rapid basis this time around.
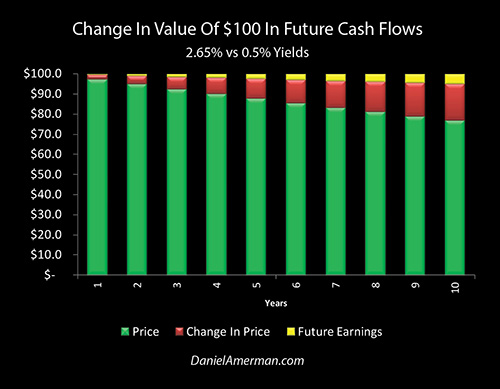
There are big changes in our graph. The present value of the cash flows today - the prices - are going up, as the direct result of the Fed forcing interest rates down. This increase in price is shown by stacking the red bars on top of the green bars.
But, the bars are still the same height - we still only get $100 in the future. So, in order to make room for the increase in the price that is being paid today, the yellow bar of future earnings has to shrink drastically. This is the only way to make the numbers add up.
An alternative intuitive perspective is that the Fed slashing interest rates means that the yellow bars of future interest earnings must sharply shrink in response, and it is the red bars of price that must expand to make up the difference.
Either perspective works, the math is the same either way, and a basic feature of how securities valuations work is that the farther out that we go in time, then the bigger the increase in the price today, and the bigger the reduction in future earnings. Ten years out, the cash flow that we were paying $77 for with a 2.65% yield, now has a value of $95.10 at a 0.5% yield. This is a gain of $18.10, and that can be seen in the red bar. And of course, with a bond, that is where most of the cash flow is - the final period when the bond matures and the principal is returned.
The necessary corollary is that to make room for the $18.10 increase in price today, someone who buys at that new 0.5% yield can now only make $4.90 dollars over the 10 years instead of the previous $23, which is a 79% reduction in profit for savers and investors.
What is illustrated above is a society wide transfer of wealth, as the result not of random free market forces, but of quite deliberate outside interventions. When the Fed takes a sledgehammer to interest rates and knocks them down, then like an old time carnival attraction, the red areas of price gains go soaring upwards, even as the yellow area at the top is sharply compressed - along with the abilities to earn current income and to compound interest earnings over time.
While the illustration has been kept as simple as possible - the implications of the cycles permeate all investment markets and every aspect of long term financial planning. The eventual impacts upon stock and real estate prices and returns are even larger than with most bonds, albeit with many more factors in play than what has been isolated above.
Bond Prices And Returns
Let's assume that we are starting with a 10 year Treasury bond, that it has a 2.65% coupon, and that we bought it at par (100 cents on the dollar). To continue our illustration, one year from now the nation is in recession, and the Fed has as a matter of policy slammed interest rates down in response.
A year has gone by, so let's get a little more technical and recognize that we now have a 9 year bond. Let's say that the 9 year yield is now 0.5%, so our 2.65% interest coupon is now well above market.
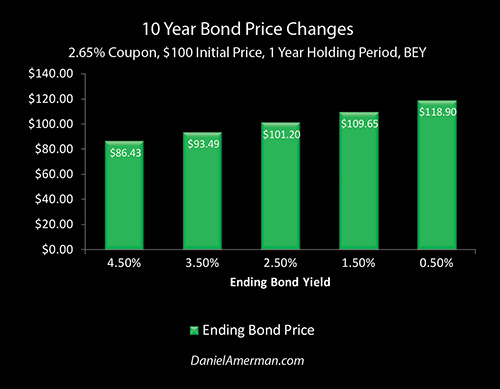
When we value a nine year bond with a 2.65% coupon at 0.5% yield, then the price has moved to $118.90, which is by itself a one year profit of almost 19 percent. (Yields are now bond equivalent, i.e. semiannual compounding).
However, we also have to take into account the $2.65 in interest payments over that year.
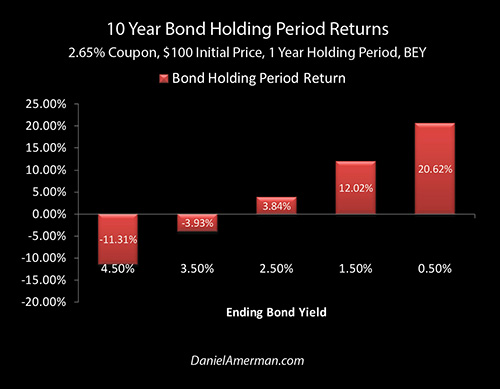
When we take into account both the interest payments and the change in bond prices, then our one year holding period return equals 20.62%. This near 21% holding period return is almost 8 times the 2.65% interest coupon on the bonds, and is more than 40 times the annual return on the bonds at the new 9 year interest rate of 0.5%.
All of those potential profits are courtesy of the Fed being stuck in a box of its own making - and knowledgeable investors understanding what to do about it.
A Nonrandom Cycle Of Amplified Gains And Losses
This analysis is but one example of the numerous practical investment opportunities for capitalizing on heavy-handed Federal Reserve interventions. As I have written about in the past (link here) primarily institutional investors have been playing the relationship between recessions and Fed policies for decades - and they have made enormous sums of money while doing so, in a highly reliable manner.
Hundreds of billions of dollars are likely to be made with this strategy if there is another recession, and it is the insiders and elites who are likely to disproportionately participate and benefit.
At the same time many millions of individual savers will see their interest income falling sharply. Unfortunately, their daily standards of living may be falling sharply as well, if they are retired and they rely upon interest payments to support their lifestyle.
If this happens, it will be yet another massive transfer of wealth from average savers - and particularly retirees - to insiders, although this will be occurring in such a way that most people won't understand how the transfer actually works. Indeed, when this happened before in 2008 and during the many years of the aftermath, it is likely that the majority of the people who were shocked by the reduction in their interest earnings, were not aware that there was not just a loss, but an actual transfer of wealth that was going on at the time.
This educational analysis demonstrates a relatively simple and easy to follow real-world example of something which is very important: how to not be a passive victim, but to instead play heavy-handed Fed interventions for money. It is intended to be a conceptual introduction to what will be a different school of investment thought for many people.
We know that the business cycle exists. We know that the Federal Reserve is currently stuck in an interest rate trap of its own making. As developed in previous analyses in this series, we also know that there is a very high probability that the Fed as a matter of policy is likely to slam interest rates back down to zero percent (or possibly below) if there is indeed another recession within the next one to two years.
Now, from most savers and investors perspectives - recession, heavy-handed Fed interventions and zero percent interest rates sound like a very toxic combination. And that is exactly what they would likely be - extremely toxic - for many investment strategies, and particularly many retirement investment strategies.
But even as amplified risks are being created - so are amplified returns. Crucially, the ways in which those outsized returns are being created is not random, but they are based upon the known intentions of an outside agency that can be at least partially anticipated in advance.
Because I believe the Fed's increasingly heavy-handed interventions have created cycles of crisis and the containment of crisis which are very important for individuals to understand, I created the framework below to help explain how these new changes in the cycles can change investment category results at various stage in the cycles.
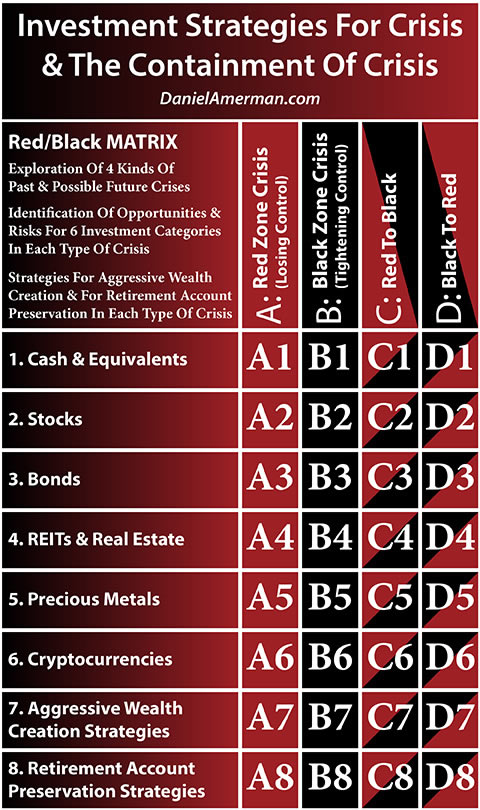
An explanatory analysis for the matrix is linked here.
In this case we have been exploring matrix cell D3, which is the intersection of the D Black to Red column for the cycles, and the 3rd row, which is the investment category of bonds. As illustrated herein, investing in 10 year Treasury bonds during a one-year transition from a Black cycle of the containment of crisis to a recession induced Red cycle of crisis, would indeed produce a 21 percent holding period rate of return (contingent upon the assumptions), even as many other investment strategies would be getting crushed.
Even as this was happening with 10 year Treasury bonds, the D column cyclical change from the containment of crisis to crisis is likely to create far larger price movements with some other types of bonds (cell D3), even as there are larger price and return changes in the other rows, such as the 2nd row of stocks (cell D2), the 4th row of real estate (cell D4), and the 5th row of precious metals (cell D5).
We live in a very different world than we used to, and investments have been working in some quite different ways over the last 20 years in particular. There are both new risks -and new opportunities. I hope you found this analysis to be of interest in learning how to see not just the heightened new risks that exist, but also some of the many amplified opportunities that are out there as well.
Daniel R. Amerman, CFA
Website: http://danielamerman.com/
E-mail: mail@the-great-retirement-experiment.com
Daniel R. Amerman, Chartered Financial Analyst with MBA and BSBA degrees in finance, is a former investment banker who developed sophisticated new financial products for institutional investors (in the 1980s), and was the author of McGraw-Hill's lead reference book on mortgage derivatives in the mid-1990s. An outspoken critic of the conventional wisdom about long-term investing and retirement planning, Mr. Amerman has spent more than a decade creating a radically different set of individual investor solutions designed to prosper in an environment of economic turmoil, broken government promises, repressive government taxation and collapsing conventional retirement portfolios
© 2019 Copyright Dan Amerman - All Rights Reserved
Disclaimer: This article contains the ideas and opinions of the author. It is a conceptual exploration of financial and general economic principles. As with any financial discussion of the future, there cannot be any absolute certainty. What this article does not contain is specific investment, legal, tax or any other form of professional advice. If specific advice is needed, it should be sought from an appropriate professional. Any liability, responsibility or warranty for the results of the application of principles contained in the article, website, readings, videos, DVDs, books and related materials, either directly or indirectly, are expressly disclaimed by the author.
© 2005-2022 http://www.MarketOracle.co.uk - The Market Oracle is a FREE Daily Financial Markets Analysis & Forecasting online publication.