


Re-examining a Popular Stock Market Long Term Bearish Signal
Stock-Markets / Stock Markets 2019 Jul 03, 2019 - 01:12 PM GMTBy: Troy_Bombardia

 The stock market has been very choppy in the past year. Over the past few months, the yield curve has been extremely hyped-up in the media and social media. I found some interesting data that makes you re-think how useful the yield curve really is for marketing timing. Today’s headlines:
- Long term volatility is high
- VVIX tanked
- Weekend gap up
- Few -1% down days
- ISM PMI
- Gold’s sentiment is retreating
- How useful is the yield curve?
Go here to understand our fundamentals-driven long term outlook. For reference, here’s the random probability of the U.S. stock market going up on any given day.

Long Term Volatility
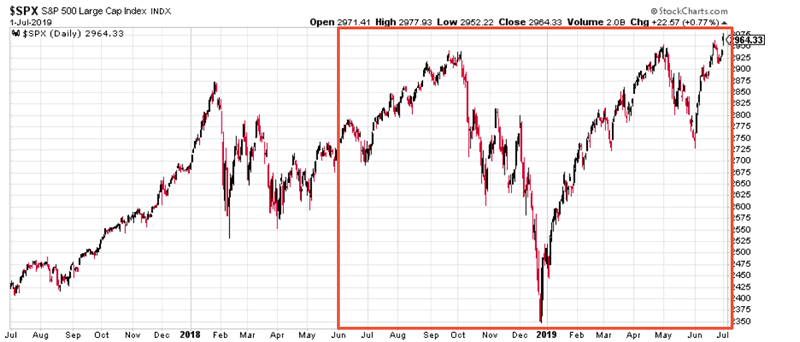
The stock market has been extremely choppy over the past year.
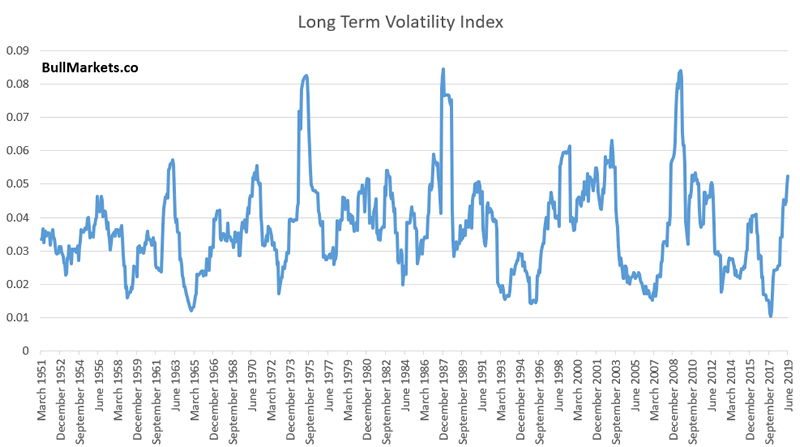
As a result, our Long Term Volatility Index has increased significantly. This is very different from late-2017, when long term volatility hit a record low.
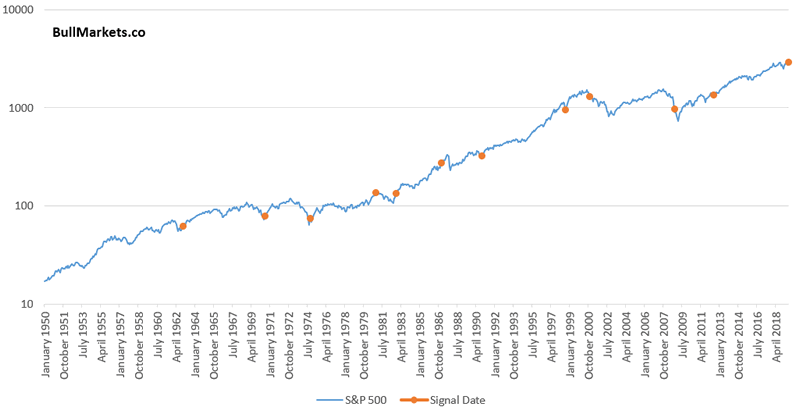
Here’s what happened next to the S&P 500 when the Long Term Volatility Index exceeds 0.05

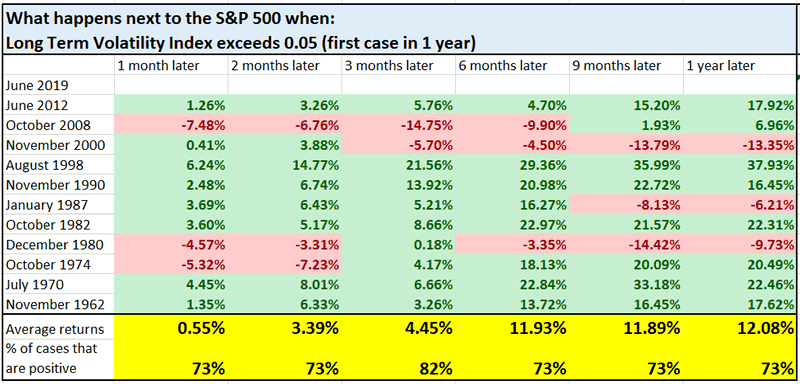
While it’s easy to assume that high volatility = bullish for stocks, this isn’t always true. It’s more useful as a 3 month forward bullish sign than a 1 year forward bullish sign.
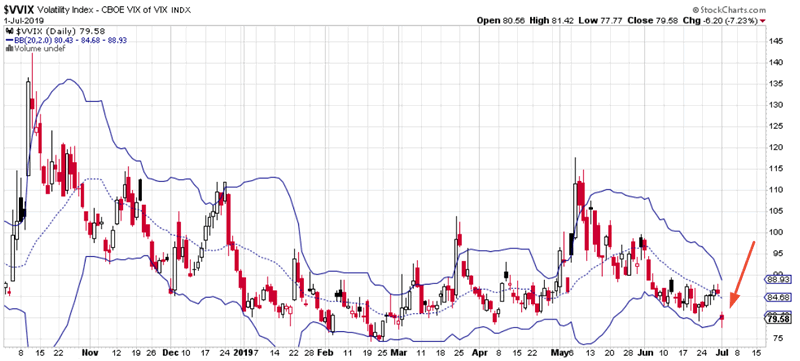
VVIX
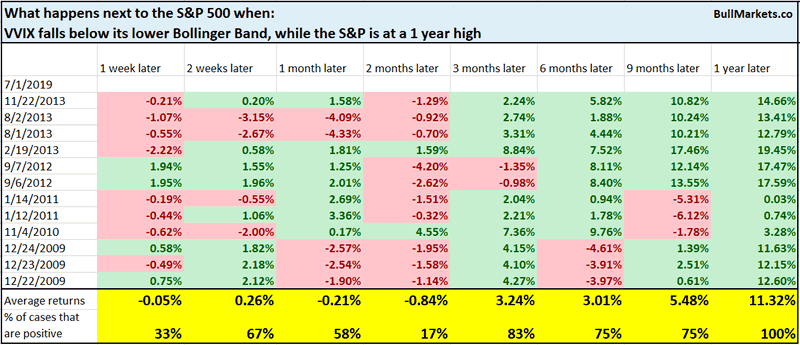
While long term volatility is increasing, short term volatility has tanked as the stock market rallies. VVIX (volatility of volatility) fell below its lower Bollinger Band today.
In the past, this was bearish for the S&P 1 week later….
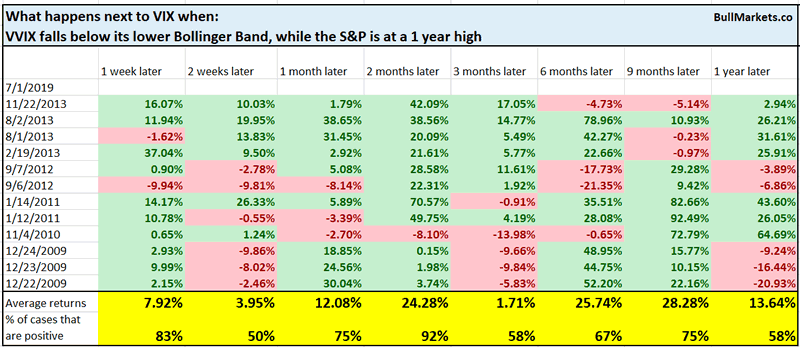
… and bullish for VIX 1 week and 2 months later.
Volatility is mean-reverting.
*Don’t take the 1 year forward returns too seriously. VVIX’s historical data is limited from 2007-present.
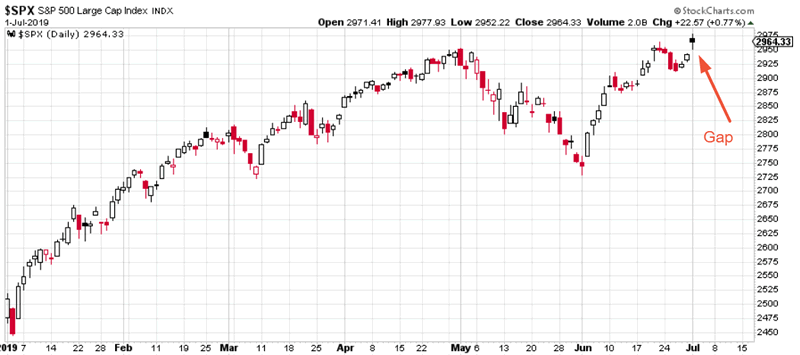
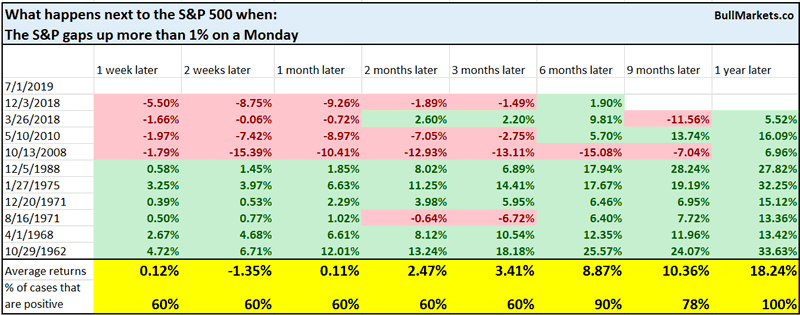
Weekend gap up
The S&P gapped up more than 1% on today’s OPEN. Weekend gaps of this size are usually news-related, and today was no exception (Trump’s G20 meeting).
Traders pay a lot of attention to gaps – in my opinion, a little too much attention. Here’s what happened next to the S&P when it gapped up more than +1% on a Monday.
Short term forward returns are random. 6-12 month forward returns are mostly bullish, but I wouldn’t use 1 day’s price action to predict 1 year.
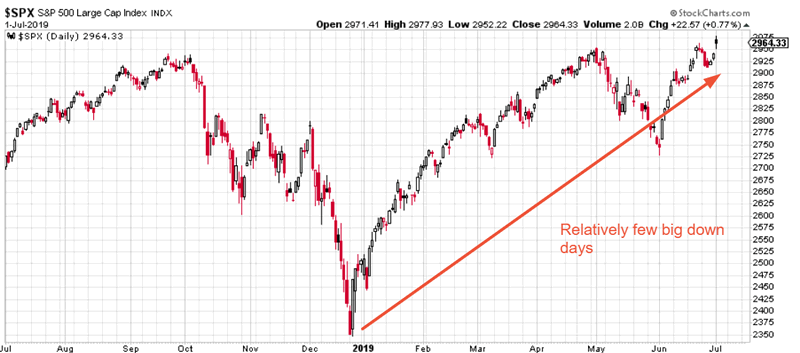
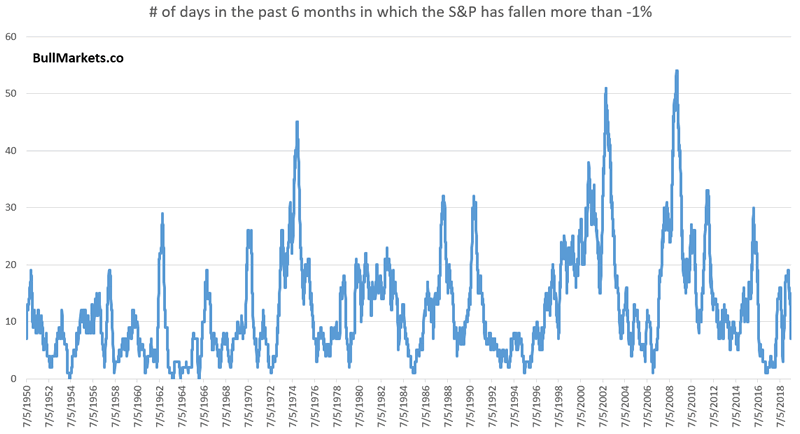
Few -1% down days
The S&P’s big rally over the past half year has seen relatively few big down days. This is uncommon, because a lot of rallies that follow -20% declines (Q4 2018) are usually very choppy (have a lot of big up and down days).
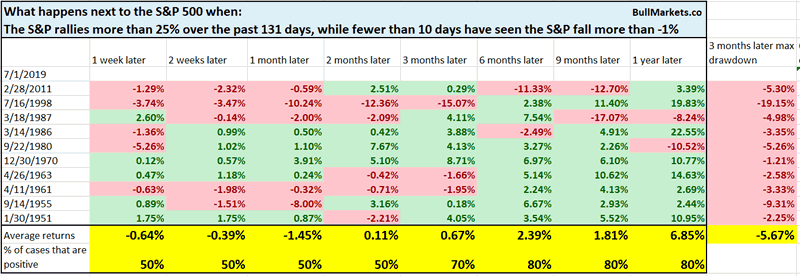
Here’s what happened next when the S&P rallied more than 25% in the past 131 days (i.e. since December 24’s bottom), while fewer than 10 days have seen the S&P fall more than -1%
Not consistently bullish or bearish in the short term.
ISM PMI
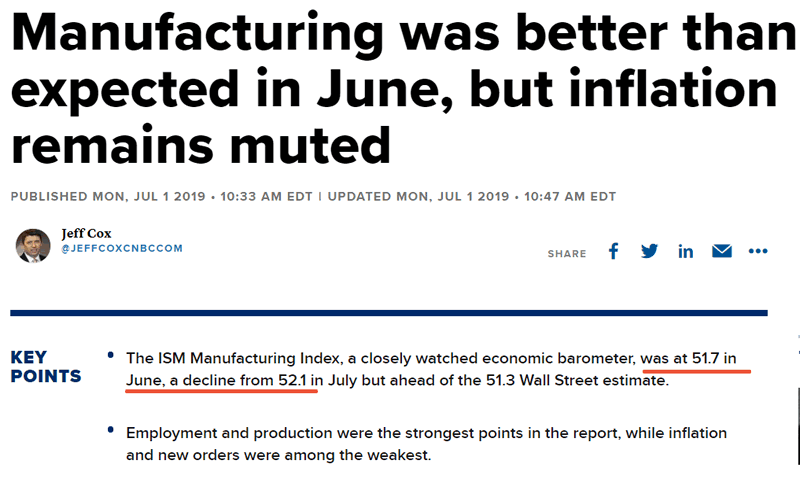
Today’s main economic data was the ISM PMI release. From CNBC:
*CNBC had a typo. Should read “was at 51.7 in June, a decline from 52.1 in May”
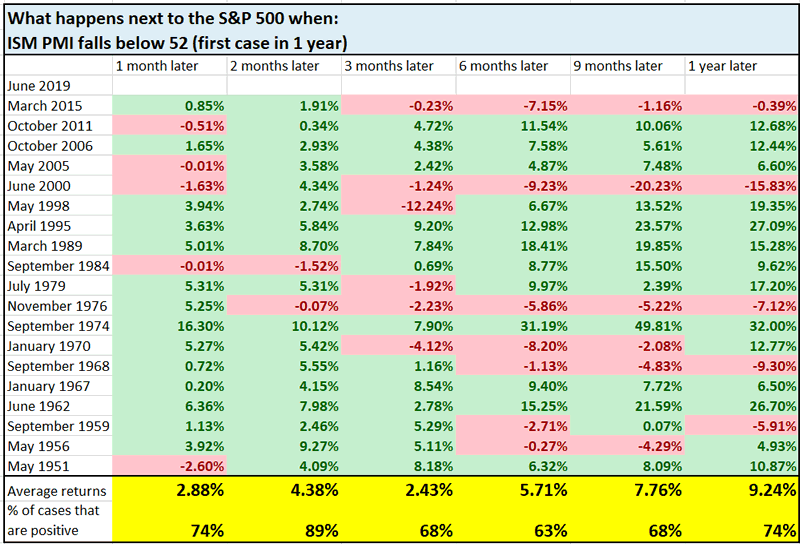
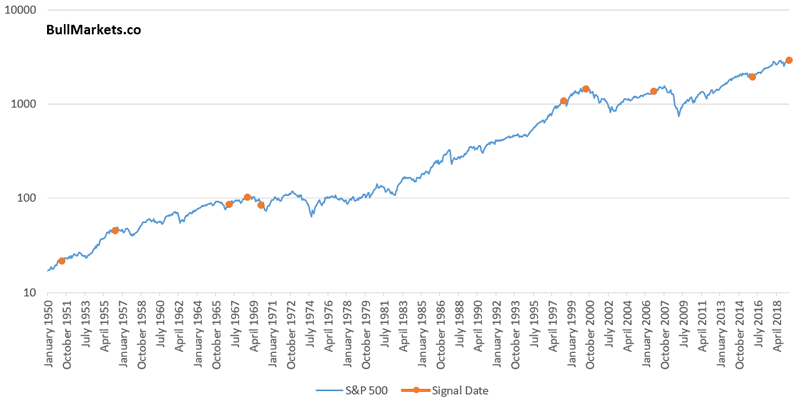
Here’s what happened next to the S&P when ISM PMI fell below 52.
Mostly bullish 2 months later. What if we only want to look at the late-cycle cases, when Unemployment was low?
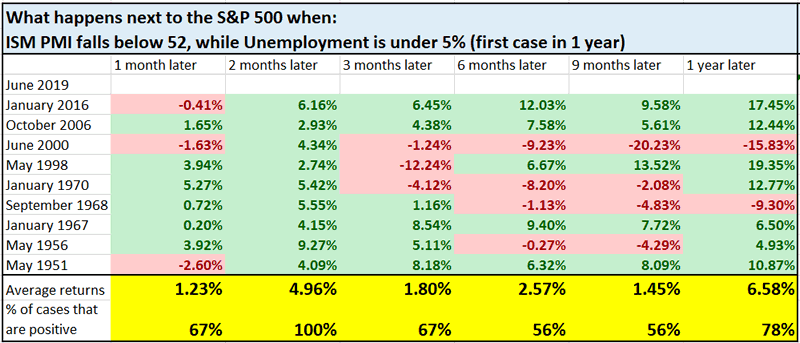
6-9 month forward returns are more bearish than random, but the 2 month forward returns are still bullish. ISM PMI is merely one of many macro data points to examine.
Gold DSI
Last week we looked at gold’s Daily Sentiment Index, which was very high. Our conclusion: sentiment is a bearish factor for gold over the next 2 months. And now that gold has pulled back, its sentiment has also fallen.
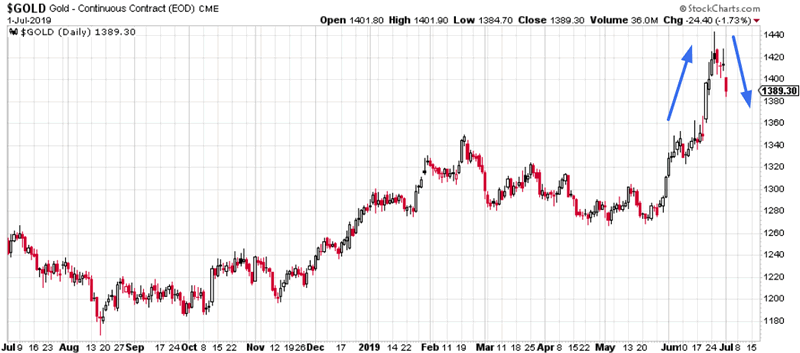
Here’s what happens next to gold when its Daily Sentiment Index falls below 80 for the first time in more than a week.
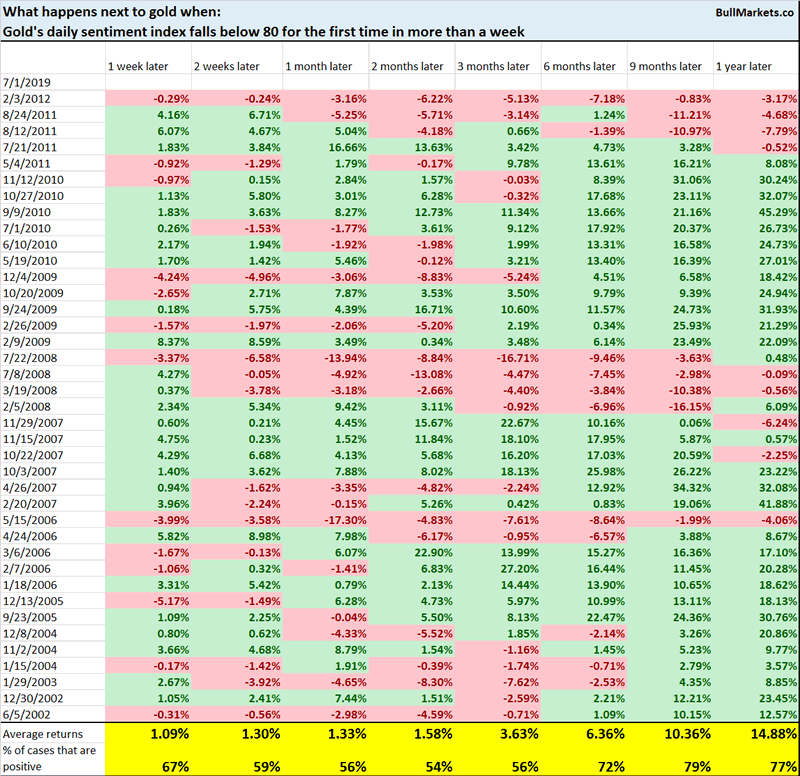
Gold’s 1 week forward returns are more bullish than random. When sentiment was this high, gold often takes some time before making a more meaningful pullback. Too many traders remember the recent spike and are looking to buy the dip.

How useful is the yield curve
When examining an indicator, it’s always important to understand how useful the indicator is. You’ve heard this a million times already – “the yield curve has been useful for predicting the last 6 recessions and their accompanying market crashes.”
But what if this time is different? Is there a possibility in which the yield curve ISN’T a great predictor of the economy and the stock market?
I came across a very interesting article from Kessler that examined the yield curve’s usefulness. To summarize:
While the last six U.S. recessions (back to 1969) were preceded by yield curve inversions, the six before that (back to 1937) were not!
Similarly, the yield curve has not inverted before the last 6 Japanese recessions.
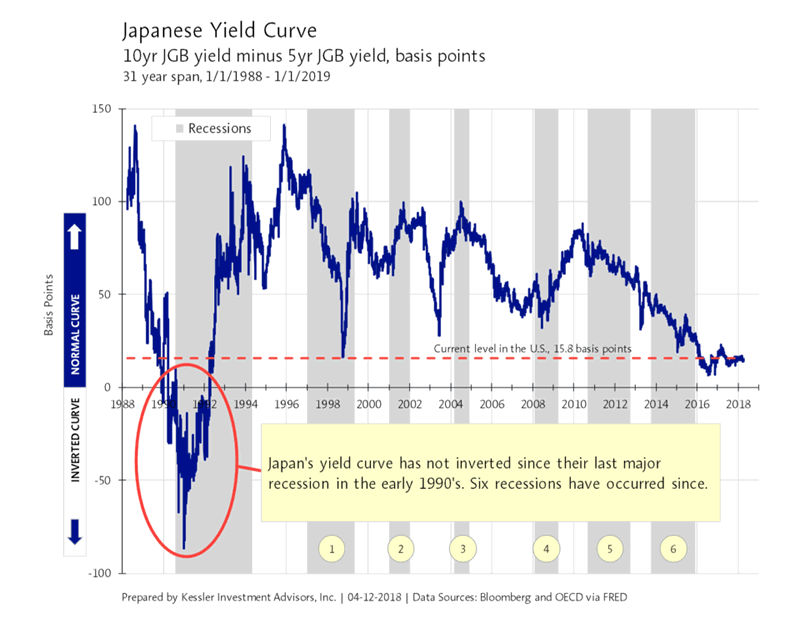
This demonstrates that the yield curve is NOT a Holy Grail. Sometimes it predicts a recession and bear market too early. Sometimes it predicts a recession and bear market too late. And sometimes it fails to predict anything.
I’m not saying that the yield curve is useless. It’s useful as a gauge of long term risk:reward. It is merely one of many macro points to consider. Given all the hype about the yield curve in the media recently, you’d think that the U.S. economy and stock market are definitely doomed.
To quote Ray Dalio: when everyone starts to use something, its usefulness deteriorates.
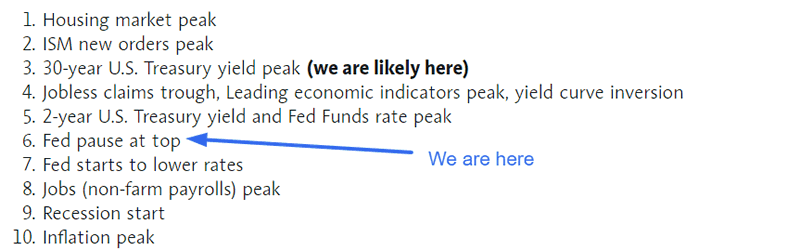
And lastly, Kessler outlined their recession roadmap in a post from last year. This is very similar to how I see things. It’s interesting how Kessler’s roadmap is almost EXACTLY how things have played out over the past 8 months.
We don’t use our discretionary outlook for trading. We use our quantitative trading models because they are end-to-end systems that tell you how to trade ALL THE TIME, even when our discretionary outlook is mixed. Members can see our model’s latest trades here updated in real-time.
Conclusion
Here is our discretionary market outlook:
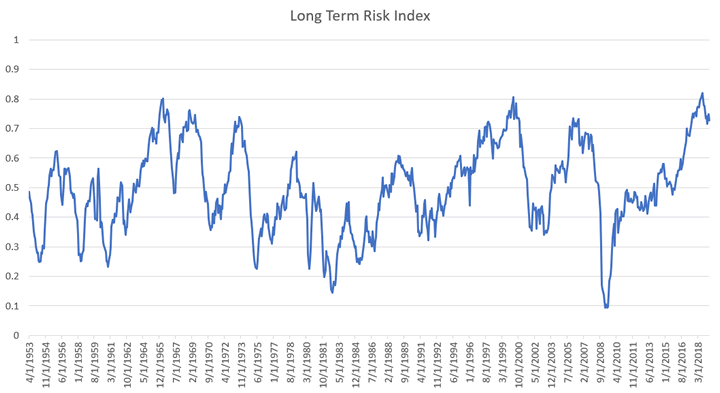
- Long term: risk:reward is not bullish. In a most optimistic scenario, the bull market probably has 1 year left.
- Medium term (next 6-9 months): most market studies are bullish.
- Short term (next 1-3 months) market studies are mixed.
- We focus on the medium-long term.
Goldman Sachs’ Bull/Bear Indicator demonstrates that risk:reward does favor long term bears.
Click here for more market analysis
By Troy Bombardia
I’m Troy Bombardia, the author behind BullMarkets.co. I used to run a hedge fund, but closed it due to a major health scare. I am now enjoying life and simply investing/trading my own account. I focus on long term performance and ignore short term performance.
Copyright 2019 © Troy Bombardia - All Rights Reserved
Disclaimer: The above is a matter of opinion provided for general information purposes only and is not intended as investment advice. Information and analysis above are derived from sources and utilising methods believed to be reliable, but we cannot accept responsibility for any losses you may incur as a result of this analysis. Individuals should consult with their personal financial advisors.
Troy Bombardia Archive |
© 2005-2022 http://www.MarketOracle.co.uk - The Market Oracle is a FREE Daily Financial Markets Analysis & Forecasting online publication.