


Gold Strong Signal For A Secular Bull Market
Commodities / Gold & Silver 2020 Jul 28, 2020 - 06:08 PM GMTBy: Dan_Amerman

As shown in the graph below, the first half of 2020 produced an unusual change in the relationship between gold prices, stock prices and recessions, something that has only happened twice before in the last fifty years. Each of the two previous times this has occurred after a long run up in stock prices, it has been part of a cyclical change to a cycle favoring gold over stocks for a decade or more thereafter.
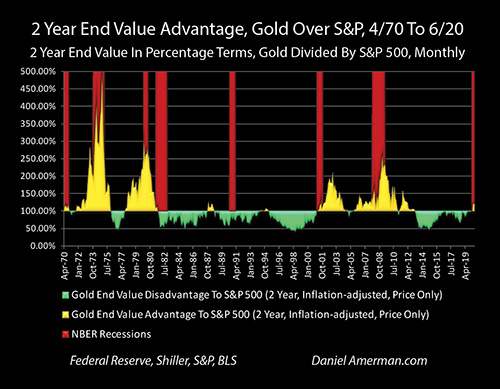
What the graph shows is the rolling 2 year advantage to gold over stocks on a monthly average basis, expressed in percentage terms. (So that monthly average prices for June of 2020 were compared to prices for June of 2018, average prices for February of 1982 were compared to those of February of 1980, and so forth). Where the area of the graph is gold, there is a two year running advantage to gold, and where the graph is green, there is a two year running advantage to stocks.
As developed in previous analyses, the purpose behind this medium term measure is not day trading, or monthly trades, or even annual trades. Instead it is used to knock the statistical noise out from shorter term measures, and to identity secular cycle swings between stocks and gold, where the advantage shifts from a long term cycle strongly favoring one asset, to a long term cycle strongly favoring the other asset.
As we will develop in this analysis, what we are now seeing with the new height of the gold area in 2020, and the sharp contrast with 2013-2019 has never happened outside of a secular cycle strongly favoring gold over stocks - with one exception, consisting of ten months in 1987-1988.
However, there was no recession at that time. So when we also take into consideration the factor of the red bars of historical recessions, and the circumstances associated with the current recession, then we can indeed say that what we are currently seeing has only happened twice before after a long cycle favoring stocks over gold (at least within the fifty years studied).
This analysis is part of a series of related analyses, which support a book that is in the process of being written. Some key chapters from the book and an overview of the series are linked here.
Understanding The Contracyclical Relationship
This analysis is an important market update, but it is not intended to be a stand-alone explanation of the two year rolling end value ratio, the secular cycles, or the extraordinary swings in profits or losses that can produced from the contracyclical relationship between stocks and gold. That information is developed in Chapter Nineteen (link here), and that is the place to go if you have any questions about the measures, the methodology, or the many implications for investment purposes.
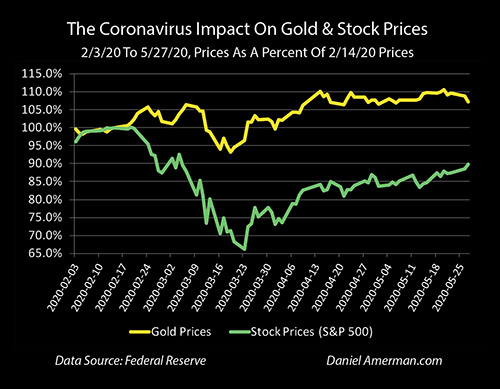
As developed in the analysis linked here, a major gap developed between gold prices and stock prices (as represented by the S&P 500 index) as the coronavirus pandemic enveloped the world, and the resulting shutdowns devastated economies and employment. The prices are shown in percentage terms, relative to the prices of gold and the S&P 500 on February 14th, shortly before the breakout occurred.
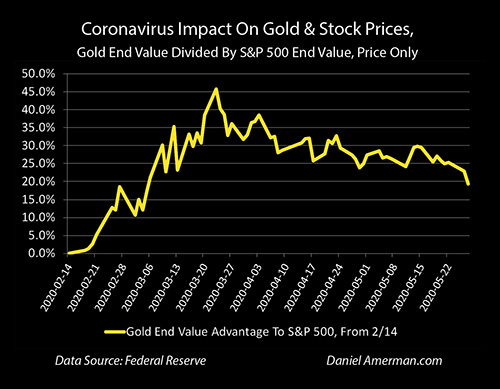
In that analysis, we started with an investor on February 14th, and compared how much their gold would be worth on each day thereafter if they had been invested in gold, compared to what the value of their stocks would have been if they had invested in the S&P 500. As an example, if gold was up 5% to 105%, and stocks were down 5% to 95%, the investor would have been 10.5% better off if they were in gold instead of in stocks (105% / 95% = 110.5%)
Looking at the actual numbers, someone who chose gold over stocks would have been 10% better off by February 24th, 20% better off by March 6th, 30% better off by March 9th, and would have peaked at being 46% better off on March 23rd, the same day the S&P 500 bottomed out at 2237.
This was a very clear cut, real time example of what my research has led me to believe is actually the most valuable use of gold for investors, which is not to use gold solely as a hedge for inflation, but to at the same time also use gold as a contracyclical asset relative to stocks, with a particular value in times of crisis (and crisis is not the same thing as inflation).
Gold over those weeks and months performed exactly as the last fifty years indicated it was supposed to, in comparison to stocks. This happened without any spike in inflation, and indeed there was a bit of deflation if we compare the Consumer Price Indexes for those same months of February to May that are shown in the graphs (before partially recovering with a bit of inflation in June).
However, there is a problem with relying too heavily on price movements over a period of a few months. When I studied those shorter term price movements over the fifty years - I just didn't find them to be all that useful or reliable. Looking at the shorter term price movements, there was a lot of randomness and "choppy" price movements, where sometimes gold and stocks would move the same direction, and sometimes they would move opposite directions. It was really hard to say whether a relative movement of gold versus stocks over a month or a few months would be at all reliable when it comes to anticipating how gold would perform relative to stocks over the next few years, or five to ten years.
But when I used the six stages of analysis laid out in Chapter Nineteen - then most of the noise dropped out, and a very clear and strong contracyclical relationship emerged, with one critical aspect being moving to a two year rolling end value advantage being a much better indicator for the secular cycles and changes in the cycles.
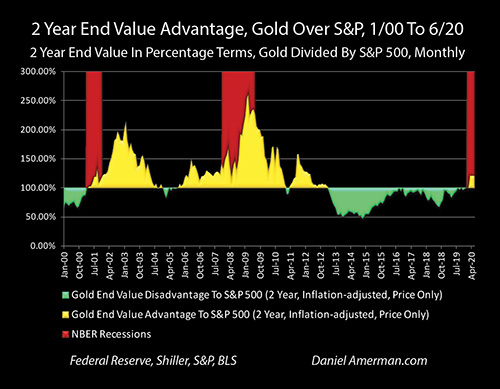
Because the first half of 2020 is a little hard to see on the fifty year graph, I'm including the same graph above, but am now just covering the period from January of 2000 through June of 2020. On a monthly basis, the change in the two year rolling average is now very clear cut and easy to see.
The two year rolling advantage jumped up to 22% when we compare March of 2020 to March of 2018, and then it was 21% for the Aprils, 22% for the Mays, and 20% for the comparison between June of 2020 and June of 2018.
It is very important to note that this is a relative relationship, not just stocks, and not just gold. The 22% two year rolling advantage to gold was strongly influenced by the precipitous decline in stock prices in March of 2020 down to 2652 (monthly average) - but it was also based on the two year increase in gold prices from an average of $1,325 an ounce in March of 2018 to $1,592 an ounce by March of 2020.
The importance of the relative relationship can be seen when we look at the average monthly index price for the S&P 500, which strongly recovered back to 3105 in June of 2020. This meant that it was back to the previous all time monthly high level of 3105 that had been set in October of 2019, and well above the index level of 2754 from two years before in June of 2018. Yet, gold still outperformed by 20%, even as stocks had substantially gained over the two years, and what made the difference was the two year move in gold prices from an average of $1,282 an ounce in June of 2018 to $1,732 an ounce in June of 2020.
There is nothing like that clear, bold two year advantage to gold during the 2013 to 2019 period that so strongly favored stocks. To see that relationship, we have to go back to the secular cycle favoring gold over stocks that lasted from 2000 to 2012. And the only exact match for a bold gold bar surging up in the red zone of a recession after a long green period of stocks dominating gold - is the June to September period of 2001, which was when the long term cycles turned from the stock cycle of 1980 to 2000, to the gold counter-cycle of 2000 to 2012.
When we return to the fifty year graph, then we see a lot of relative advantage to gold during the secular cycle of 1970 to 1980, including a similar surge up in the gold two year end value advantage area on the front end, even as the recession of December of 1969 to November of 1970 was in progress.
The Single Exception & Comparing The Fundamentals
Out of all the monthly two year rolling averages for entire fifty years, there is only one place where something comparable with the first half of 2020 happened, with even a 10% or more gain for gold relative to stocks on a two year rolling average, that was not associated with a secular cycle of gold outperforming the S&P 500 on a price basis. This was the ten months from November of 1987 through August of 1988.
While the timing may sound a bit obscure for younger readers, people of an age will of course recognize the correlation with one the biggest investment market moves of a lifetime, the Black Monday crash of October 19, 1987, with the S&P 500 falling 20% in a single day, the DJIA falling 22%, and much worse moves in many foreign markets.
Gold had already been trending upwards, and was trading at its highest levels since 1981 (1983 in inflation-adjusted terms). Gold jumped a bit higher still, stocks took a while to recover, and there was about a 20% two year advantage to gold that persisted for less than a year, with the advantage being similar to today.
With the benefit of many years of hindsight - Black Monday was a panic and not a crisis. There was no fundamental change in the economy in the form of a recession, there was no huge surge in unemployment, and there was no major decline in corporate earnings.
However, at the time, investors in both gold and stocks thinking and acting like there really was a crisis, produced an anomaly not seen at any other time over the last fifty years - a brief but significant (>20%), rolling two year advantage to gold over stocks, that existed outside of a secular cycle favoring gold over stocks.
Then fears of crisis receded. Stocks resumed a march upwards all the way to the heights of 2000, and an annual average inflation-adjusted S&P 500 index price that was about 2.7 times higher than it was in 1987. Gold would resume its downwards march towards the depths of an inflation-adjusted price per ounce in 2000 that was about 61% lower than it was in 1987. Investors would be about 7X better off being in stocks than gold over the next 13 years, even on a price only basis, as one of part of the secular stock cycle that would favor stock investors over gold investors by a whopping 26 to 1 margin over the full 1980 to 2000 cycle (as covered in Chapter Nineteen).
Factoring In Genuine Crisis
That was the single exception - and the record is quite different when there is an actual crisis, as opposed to fears that a crisis could develop.
We have only two other instances of seeing a 10%+ two year rolling advantage shifting to gold after a long bull market in stocks, those were both associated with genuine crises that would become a series of crises - and each one of those did indeed call the beginnings of a secular shift in the cycles to gold strongly outperforming stocks for the next decade or more.
By the early 1970s, inflation was heating up, and Bretton Woods was breaking down, meaning the last link between the value of the dollar and the price of gold was collapsing. The next decade would bring stagflation and economic "malaise" with the combination of the highest rates of U.S. inflation in the modern era, as well as a series of recessions with high unemployment. Many thought that the U.S. economic miracle had ended for all time.
After major gains in the 1960s, the Dow Jones Industrial Average peaked in inflation-adjusted terms in May of 1968, and would fall for the next 14 years, bottoming out with a 70% loss in inflation-adjusted terms by November of 1982. This was by far the worst damage the stock market took outside of the Great Depression, but most investors aren't even aware that it happened, because the destruction of the purchasing power of stocks was being covered over by inflation and the destruction of the purchasing power of the dollar, as explored in the analysis linked here. (This is something that it seems retirement investors should be keenly aware of, this 14 year destruction of the purchasing power of stock portfolios, but it is not part of the usual financial education and most people relying on stocks in retirement seem unaware.)
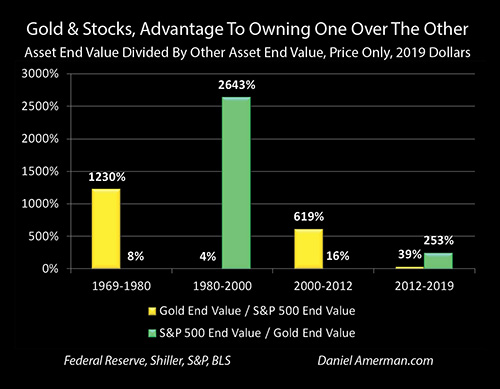
Put together the explosion in the value of gold as inflation shredded the dollar, and the destruction of much of the purchasing power of the stock market, and we have a secular cycle favoring gold, where gold investors would outperform stock investors on a price basis by a more than twelve to one margin over the 10 years from 1970 to 1980.
What started that major change in the cycles - was a 15% advantage to gold over stocks on a two year rolling basis, in the midst of the red bar of a recession, as shown in the graph repeated below.
That same pattern of a rolling two year advantage to gold over stocks during the red bar of a genuine recession would reappear again - for the first time since September of 1981 - in April of 2001. The tech bubble was in the process of bursting, there were massive stock losses, a recession was underway, and by July of 2001, gold had outperformed stocks over two years by about 20%, which is very similar to the numbers today. Gold would then soar for the next eleven years, as the tech bubble collapse would be followed by the real estate bubble collapse and the financial crisis of 2008, with gold investors outperforming stock investors on a price basis by about 6 to 1 over the 2000 to 2012 secular cycle.
In some ways, 2020 could be called the complete opposite of 1987, and the Black Monday panic that turned out to lack an underlying fundamental crisis. This time around, the underlying fundamentals are some of the worst we have seen in our lifetimes. Unemployment has exploded, and much of the economy remains shutdown.
The recession is global, and revenue streams based on foreign markets could be lower for years to come. Millions of jobs in travel related industries may no longer exist. Potentially millions of restaurants, bars, shops, and other small businesses who came into the government ordered shutdowns of their businesses with few cash reserves, and who lacked the easy access to the Federal aid provided to medium and large corporations, may never open their doors again.
In contrast to 1987 - stock prices have remained high, not because of economic or natural market conditions, but because of the Federal Reserve creating record sums of money to support markets and to fund extraordinary Federal government deficit spending.
However, when we look not just at stock prices, and not just at gold prices, but at gold prices relative to stock prices over the medium term using a two year measure (thereby removing much of the short term statistical noise), then we see something that is quite rare. Out of the 603 two year holding periods studied, ranging from April of 1968 to April of 1970 on the front end, and June of 2018 to June of 2020 on the back end, investors have never favored gold to this degree over stocks in the midst of underlying fundamental problems, without it being part of a secular cycle favoring gold over stocks.
Seeing The Fundamentals
Why would this would be such a rare occurrence, and why would it be a good signal of something real, a fundamental change?
For purposes of clarity - I'm a fundamental analyst, not a technical analyst. "Fundamental" versus "technical" are two quite different schools of investment analysis, and while they can overlap - just seeing a pattern in a chart isn't good enough for a fundamental analyst.
Fundamental analysts look at things like the economy, corporate earnings, debt coverage ratios, inflation-adjusted interest rates, future values and present values, and other such factors. Tracking economic and financial history can be just as important to a fundamental analyst as a technical analyst, but price changes aren't enough, things have to make sense in terms of the underlying economic and financial fundamentals.
So why would this measure matter? This particular measure is based on years of quantitative research (there are underlying reasons for choosing two years), but let me provide an intuitive explanation as best I can.
Markets move in long cycles, when it comes to the valuation of shares of stocks, as well as the inflation-adjusted price of gold. Over the course of a long stock cycle, which is often dominated by economic prosperity, the amount of corporate earnings rises, AND the value that investors place on each of those dollars of corporate earnings rises, AND the optimism that investors have about future earnings rises. This three way combination of more earnings, more value being placed on each dollar of earnings, and more confidence in pricing in today that future earnings will be still higher, can lead to much higher stock prices than can be justified by just the underlying earnings alone.
The more the time that passes since the last major crisis or inflationary bout, the less the degree of fear that the average investor feels, the less the demand for gold, and the lower the price of gold falls in inflation-adjusted terms.
What history shows us is that this continues over time, and we get secular (long term) cycles. In a stock cycle, investors grow increasingly confident even as the underlying economic fundamentals continue to be positive, and gold prices can continue to underperform or slide as fears of inflation and crisis continue to recede. So we get not just a single two year cycle, but a long string of two year cycles, each one favoring the relative performance of stocks over gold.
Then something rare happens. There is a major, fundamental change, that includes an actual economic downturn. But there is more to it than that, there have been many economic downturns.
The market as a whole, looks at the situation - and through its actions, freaks out a bit. It is as if the collective market says " Oh geeze, this is bad, the party's over." The reaction is so strong that the previous two full years of gains for stocks relative to gold are all given up, and then the price of gold goes substantially above that (relative to stocks).
Now, markets go up and down based on the ongoing battle between greed and fear all the time, there is a great deal of noise and clutter all the time, particularly when we look at daily, weekly or monthly changes.
But when we look at the combination of 1) being in a long term cycle favoring stocks; 2) the nation entering in an actual economic downturn; and 3) the market's evaluation of that particular downturn being so bad that two full years of stock gains relative to gold are given up - and quite a bit more (10%+) - that is not at all normal or common. Indeed, an investor who had been in the market for fifty years, would have only seen that combination two times before in all of those years, before this spring.
Each time - the market turned out to be right. Each time, there was a secular change in the cycles, and the contracyclical asset of gold would strongly outperform stocks on a price basis for many years to come.
A Collection Of Unprecedented Events
I'm not a believer in infallibility, but I am a believer in information value.
So, just because we've never seen something before doesn't mean it couldn't happen.
It could.
The secular cycle favoring stocks could indeed resume. To my mind, saying that couldn't happen and we know that with 100% confidence there will be a secular cycle favoring gold, is simply far too high of barrier in the real world, it just isn't reasonable to say that we could know something like that for sure.
This is particularly the case in a investment world of pervasive and unprecedented central banking interventions dominating the markets. Indeed, a very strong case could be made that the entire rebound in stocks is being driven by massive Federal Reserve interventions as part of a cycle of the containment of crisis - which was not part of the long term historical record. The battle between the current level of economic collapse and the unprecedented degree of monetary creation to fund extraordinary economic and market interventions will take us into completely new territory.
However, there is information value when it comes to making and assessing investment plans that are dependent on something happening that hasn't happened before. When we take that perspective, then the impossible task of knowing with certainty is removed. Instead, the "burden of proof" flips and we can simply say that we have never seen something before, so now we have to make a case for something happening for the first time (or at least in the last fifty years).
There are two profoundly important and quite practical implications for individuals when we flip that perspective, and look at using investment strategies that are dependent on something happening that hasn't happened before.
The first implication is that we should think through just what is the evidence that is so overwhelming that we can bet our future financial security on something happening for the first time - for sure?
It is very rare for the markets to make a call of this magnitude, it has only happened twice before in the last fifty years, stocks have strongly underperformed for a decade or more each time thereafter - what is the compelling argument for why we can be so sure, in the midst of what may be the worst downturn yet, that this time will be different, and that we can build our entire retirement investment strategy around that assumption?
That can be a difficult standard of proof - as it should be, when it comes to asserting that a first time event is the only reasonable possibility.
The second implication is perhaps the more important one, even if it is one that most individual investors seek to avoid. This implication is the introduction of doubt, in the form of at least reasonable doubts, and perhaps very strong doubts.
When something like this happened in the early 1970s, what would follow was not only recession and inflation, but what would become a 70% inflation-adjusted loss in the purchasing power of the Dow Jones Industrial Average (1968-1982). Between 1970 and 1980, on a price basis, an investor in gold over the secular cycle would have ended up with 12X the net worth of someone who invested in stocks (and yes, dividends mattered, but they are nowhere near where they used to be, particularly on an inflation-adjusted basis).
The employment blow the United States just took over the matter of a few months was far harder than anything experienced in the stagflationary 1970s - can we really make our plans with confidence based on assuming that the 2020s will be a much better decade for stock investors relative to gold investors - or should we have our doubts? Strong doubts?
When the tech bubble popped in 2000-2001, gold was languishing at near two decade lows, and the idea that gold could outperform stocks would have seemed laughable to many investors, particularly those who had been day trading the creation of the stock bubble. Yet, as part of the collapse of the tech bubble, the collapse of the real estate bubble, and then financial crisis of 2008, gold would outperform stocks on a price basis by 6 to 1 in the 2000 to 2012 era.
We already have a hit to the global economy that exceeds what we saw in 2008, with a financial system that is only being held together by monetary creation and deficit spending on a scale far greater than what was seen in even the depths of the prior financial crisis. Can we really just make a base case assumption that what happened before won't happen again (or worse)? Or should we have doubts? Strong doubts?
Perhaps the most interesting part about understanding the contracyclical relationship between stocks and gold, is that it provides both signals and solutions. We have just seen a rare but strong signal, that has happened only twice before after long stock market run ups and while a recession in process. Each time, there has been a change to a secular cycle favoring gold over stocks by very large margins over the long term.
But we don't need to know that will happen for sure. Because gold and stocks are contracyclical assets. That means that using the two in combination in targeted strategies can be a very good tool for dealing with (well-justified) doubts. As introduced in Chapter Nineteen (link here), when we understand the historical mathematical relationship between gold and stocks, this opens up an entire range of risk reduction strategies, including rebalancing strategies, ratio strategies and combinations thereof.
Gold can be a wonderful investment for inflation. It can be an even better tool for financial crisis, or when deployed inside of combined strategies with stocks for risk reduction while still maintaining positive inflation-adjusted returns. What is best of all - is understanding both uses, and hopefully the free book and the series of gold analyses have been helpful to you in that regard.
Learn more about the free book.
Daniel R. Amerman, CFA
Website: http://danielamerman.com/
E-mail: mail@the-great-retirement-experiment.com
Daniel R. Amerman, Chartered Financial Analyst with MBA and BSBA degrees in finance, is a former investment banker who developed sophisticated new financial products for institutional investors (in the 1980s), and was the author of McGraw-Hill's lead reference book on mortgage derivatives in the mid-1990s. An outspoken critic of the conventional wisdom about long-term investing and retirement planning, Mr. Amerman has spent more than a decade creating a radically different set of individual investor solutions designed to prosper in an environment of economic turmoil, broken government promises, repressive government taxation and collapsing conventional retirement portfolios
© 2020 Copyright Dan Amerman - All Rights Reserved
Disclaimer: This article contains the ideas and opinions of the author. It is a conceptual exploration of financial and general economic principles. As with any financial discussion of the future, there cannot be any absolute certainty. What this article does not contain is specific investment, legal, tax or any other form of professional advice. If specific advice is needed, it should be sought from an appropriate professional. Any liability, responsibility or warranty for the results of the application of principles contained in the article, website, readings, videos, DVDs, books and related materials, either directly or indirectly, are expressly disclaimed by the author.
© 2005-2022 http://www.MarketOracle.co.uk - The Market Oracle is a FREE Daily Financial Markets Analysis & Forecasting online publication.