


Gold Gains Wiped Out By Chaotic Price Action
Commodities / Gold & Silver Oct 12, 2008 - 07:17 AM GMTBy: Merv_Burak

 While the world's markets were dropping like a rock all week long gold was moving higher, until Friday. Almost the full week's gains were whipped out on Friday. So, now what? A person would have to be nuts to try and forecast what's to come in this environment. Let's just see where we are and go with that.
TECHNICAL ANALYSIS CONFERENCE
Just a few words before getting into today's commentary. There will be a Technical Analysis Conference in Toronto on Nov. 1, 2008 . Presenters will include biggies such as Robert Prechter and some not so biggies such as yours truly. My presentation is on Gold & Gold Stock Movements: Where From, Where Now, Where Next. For those who may be interested in attending, information may be found at www.csta.org .
GOLD : LONG TERM
As I understand it the general market, you know, the Dow, S&P and so forth, had a slight hiccup this past week. In my charts they had been bearish since the first of the year when their long term moving average lines turned downward. Gold has been more resilient and whether it is bullish or bearish depends upon which indicators or charts you are looking at. The long term P&F chart went bullish a few weeks ago but just about reversed itself. Last week I mentioned that the reversal took the P&F chart right down to the up trend line but not below it. During the week gold was rallying most of the time but dropped like a rock on Friday. It neither made new highs on the P&F chart during the week nor did it move below that up trend line on Friday. We still need a move to the $810 level for gold to once more become bearish per the long term P&F chart.
As for the usual indicators, gold has been moving above and below its long term moving average line. Friday gold closed below the line and the line slope is very gently trending downward. The long term momentum indicator (daily version) has been moving in a somewhat lateral direction but bouncing above and below its neutral line. On the Friday close the momentum ended just a hair above its neutral line but heading lower and was below its negative sloping trigger line. The volume indicator had been weak lately but moved higher during the week with the gold price. However, it is still underperforming the gold price action and is a worry. The normal indicators have not improved enough to upgrade my previous long term rating for gold. It remains BEARISH at this time.
INTERMEDIATE TERM
We are in a period where the gold price and various indicators are in their volatile mode and when we can get whip-sawed very quickly. That's what has been happening lately. The indicators were bearish in mid-Sept, went bullish at end of Sept, went bearish again last week and bullish again this week. Friday it almost went bearish again. One has to sometimes live with this volatility until a clear trend is generated. Today, the Index closed just above its moving average line and the line, which had turned upwards once more turned down on Friday. The momentum indicator, which had been hugging its neutral line for many months now (except for a few week period when it really went negative in Aug/Sept) once more broke below its neutral line into the negative. It also dropped below its trigger line and the trigger has once more turned into the downward slope. Today, the indicators have combined to give me a BEARISH rating. The way things are going Monday it could easily be reversed.
SHORT TERM
With a volatile environment such as we are having at the present it is very difficult for a technician to decipher the daily supply/demand battle which is our thing. The daily movements have no relationship to any strategic decisions being made by professional speculators. The daily action is more pure emotion day to day. Until the world financial situation stabilizes we can continue to expect wild gyrations in the gold markets. Having said that; let's see if we can decipher anything in the on going gold market.
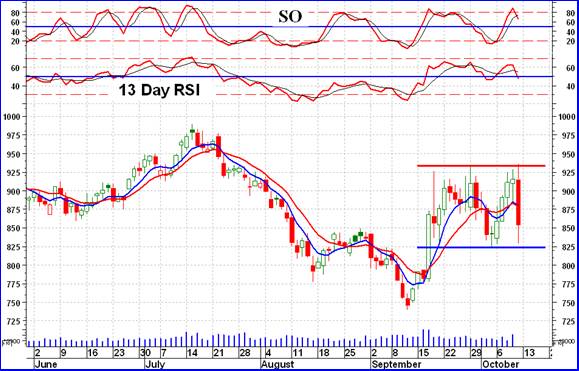
On the short term we seem to have stabilized within a very wide band of price levels. We seem to have a firm resistance level established around the $930 price level and a support established at around the $825 level. This over a hundred dollar band gives the gold market some reasonable leeway for volatile action. Short term the market can bounce around changing direction almost on a daily basis. As of the Friday close we have gold closing below its short term moving average line and the line turning downward. The momentum indicator has just entered its negative zone below its now negative trigger line. While I like to see the short term direction confirmed by the very short term moving average line being either above (bullish) or below (bearish) the short term line, at the Friday close they both are basically occupying the same space. Another day or two of activity is required for the two to separate. I would rate the short term as BEARISH at the present time.
As for the direction of least resistance, that would be to the down side after Friday's action. However, as noted, this market could turn on a dime.
SILVER
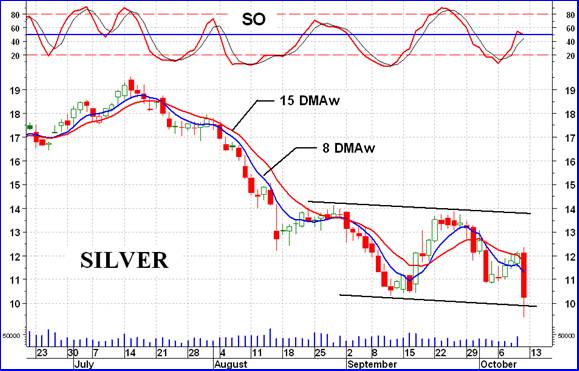
During the past month or so we have seen a real difference in the performance of silver versus that of gold. During the rally a month ago silver was not able to exceed its August high. Now during the recent decline it has almost gone into new lows. This past week's rally was very muted. One wonders why this difference in performance since both gold and silver are suppose to be metals favored by those who are escaping financial turmoil. It appears that suddenly speculators are placing the greater emphasis on silver as just another industrial commodity required for economic activity and that activity has suddenly started to disappear. For the future, until shown otherwise, it might be advantageous NOT to be considering silver as a precious metal. I will continue with it in these commentaries and in the tables because who knows how quickly such sentiment might change again.
Non-Edibles Futures Indices
The chart shown here today is not related to gold but is a chart of a composite Index that I have been keeping up to date for a few years now. It is a composite Index of 26 futures contracts representing several categories which I call non-edibles. These include metals, energy, currencies, Indices and financials.
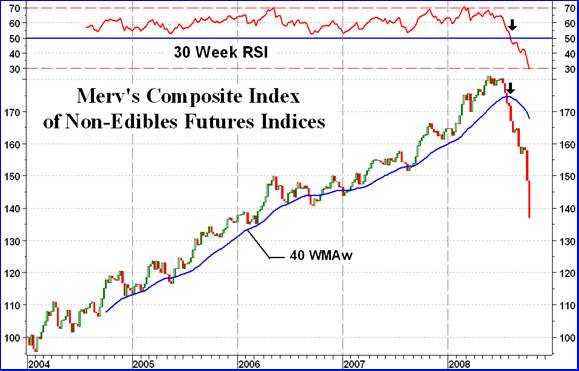
I think that this Index is a good representation of what is happening in the global markets and economy. As such it is instructive to take a look and see if it would have given us any indication of the global problems we have been experiencing in recent weeks.
Since its development in early 2004 this Index has been on a roll. The long term moving average line had remained positive in slope and the long term momentum indicator remained in its positive zone. The few times that the Index moved below its moving average line were warnings, but the slope of the moving average continued positive. Actually, this demonstrates the old technical concept that when an Index or security price returns back above its positive sloping long term moving average line, that is a good thing for continuation of buying operations.
In the first week of August the Index closed below its moving average line and this time the line, for the first time in years, turned downward. At the same time the long term momentum indicator dropped below its neutral line into the negative zone. This was a clear indication that something serious was happening in the global economies. Boy was it ever right on the mark. In the space of 13 weeks (one quarter of a year) the Index erased more than 50% of the advance of the previous 4 ½ years. Only in the past few weeks has it become real evident that something is not totally right on the global scene.
Now, it's time to start watching the Composite Index to see if it will give us the same warning of better times ahead by moving above its long term moving average line, having the line turn upwards and having the long term momentum indicator move back into its positive zone.
Unlike many charts and sophisticated indicators that you might see on the internet, you can't get much simpler than this Composite Index with the moving average and long term momentum indicator (a 30 week RSI). So far, so good. Let's hope it does as good a job in the upside direction.
Precious Metal Stocks
Despite the performance of gold, the precious metal stocks took a real drubbing this past week, following a similar drubbing of the week prior. The Table below tells the story. I'll forgo commentary in this section this week but will be back next week. Hopefully it will be a better week.
Merv's Precious Metals Indices Table
Let's call it another week.
By Merv Burak, CMT
Hudson Aero/Systems Inc.
Technical Information Group
for Merv's Precious Metals Central
For DAILY Uranium stock commentary and WEEKLY Uranium market update check out my new Technically Uranium with Merv blog at http://techuranium.blogspot.com .
During the day Merv practices his engineering profession as a Consulting Aerospace Engineer. Once the sun goes down and night descends upon the earth Merv dons his other hat as a Chartered Market Technician ( CMT ) and tries to decipher what's going on in the securities markets. As an underground surveyor in the gold mines of Canada 's Northwest Territories in his youth, Merv has a soft spot for the gold industry and has developed several Gold Indices reflecting different aspects of the industry. As a basically lazy individual Merv's driving focus is to KEEP IT SIMPLE .
To find out more about Merv's various Gold Indices and component stocks, please visit http://preciousmetalscentral.com . There you will find samples of the Indices and their component stocks plus other publications of interest to gold investors.
Before you invest, Always check your market timing with a Qualified Professional Market Technician
Merv Burak Archive |
© 2005-2022 http://www.MarketOracle.co.uk - The Market Oracle is a FREE Daily Financial Markets Analysis & Forecasting online publication.