


Gold Price and the ‘Taper Tantrum’
Commodities / Gold and Silver 2021 Aug 22, 2021 - 07:55 PM GMTBy: Richard_Mills

Gold prices are slipping as talk of a “taper tantrum” has investors thinking that the US Federal Reserve’s bond-buying program could be scaled back.
Over the last three days spot gold has dropped $18, peak to trough, on news of US jobless claims falling sharply to 348,000, and the US dollar scaling over a nine-month peak. The dollar’s rise makes gold expensive for holders of other currencies and therefore dents demand for the precious metal.
Good job news indicative of a potential taper and interest rate increase was also responsible for a gold take-down on Aug. 9, when the spot price and gold futures both settled around $1,726, the worst since Mid-April.
A few factors have taken the shine off gold, including a strong US economic recovery with lower unemployment and healthy manufacturing data (the IHS Markit US Manufacturing PMI has risen from 59 in January to 63.4 in July); a climbing US dollar index (from 89 in January to its current 93.56), and most importantly, persistent rumors that the US Federal Reserve will reduce its current $120 billion per month asset purchases designed to flood the financial system with money for lending out, and follow that up with a rise in interest rates.
Because gold does not offer a yield, any suggestion of raising rates makes it less attractive to investors looking for interest on their investments. And because gold is a hedge against inflation, winding down the Fed’s balance sheet (a tally of asset purchases) also dents gold’s appeal because there is less chance of rising inflation caused by a continuation of “quantitative easing”.
QE for short, is a technique used by the US Federal Reserve and other central banks to stimulate the economy in times of crisis. The Fed buys up securities from its member banks, thereby adding new money to the economy (this is where the expression, the Fed is “printing money” comes from).
The idea is to free up more money for banks to make loans to individuals and businesses, thus growing the economy. The money is not cash, but credit that is added to banks’ deposits. When it wants to print money, the Fed lowers the federal funds rate, and banks in turn lower their interest rates, making capital more affordable so that businesses and investors are more likely to borrow.
The Fed used quantitative easing in the wake of the 2008-09 financial crisis and it did so again in 2020 to deal with the coronavirus pandemic.
QE was successful in preventing a financial meltdown during 2008 and 2020, but the effect has been a reliance on cheap credit that has fueled both a stock market bubble and a real estate bubble that many observers believe is in danger of popping. Bond investors have also become addicted to Fed stimulus.
To a large extent this is déjà vu.
In 2013 then-Fed Chair Ben Bernanke announced in a press conference that the Fed would gradually reduce the pace of monthly bond purchases — so-called tapering — and that it would eventually end its quantitative easing program.
The very idea of the Fed reducing its rate of asset purchases sent bond investors running for the exits. They responded to the prospect of future declines in bond prices by selling en masse. This “taper tantrum” depressed bond prices and caused yields to spike, including the yields on US Treasuries. Long-term Treasuries (the 10-year and the 30-year) are a proxy for interest rates and gold prices react to their movements up or down.
As the charts below show, the US 10-year Treasury yield went from 1.72% on April 22, 2013, to 3.04% on Dec. 31, 2013, while spot gold plummeted from $1,423 on April 24 to $1,202 on Jan. 1, 2014. They kept sliding to $1,060 at the end of 2015, a level not seen since November, 2009. Higher yields were clearly a major factor in gold’s poor performance.
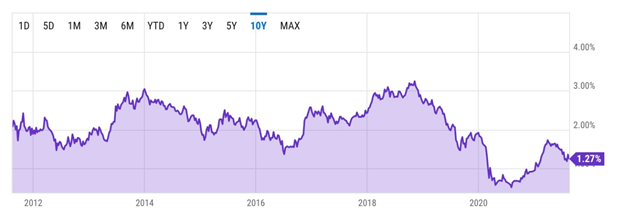
US 10-year Treasury rate. Source: YCharts
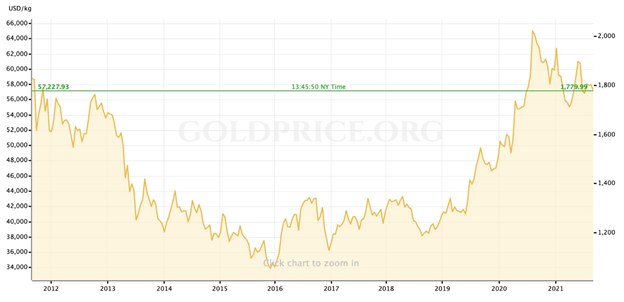
10-year spot gold price. Source: Goldprice.org
What we want to know is, could it happen again? The answer is possibly, but probably not. The reason is that the financial conditions in 2021 are quite different from 2013, and the gold market is also stronger, ie., it is more able to handle headwinds like a gradual reduction in asset purchases, or even rising interest rates, without crashing and burning like it did during the last gold bear market of 2013-16. To prove this thesis, we need to look at some of the factors behind gold prices.
Real yields
Several factors influence gold prices (mainly the US dollar, gold ETF inflows/ outflows, inflation rate, bond yields, safe haven demand, physical gold demand, gold supply) but none is more reliable than real interest rates/ yields.
The demand for gold moves inversely to interest rates — the higher the rate of interest, the lower the demand for gold, the lower the rate of interest the higher the demand for gold.
The reason for this is simple, when real interest rates (interest rate minus inflation) are low, at, or below zero, cash and bonds fall out of favor because the real return is lower than inflation. If you are earning 1.6% on your money from a government bond, but inflation is running 2.7%, the real rate you are earning is negative 1.1% — an investor is actually losing purchasing power. Gold is the most proven investment to offer a return greater than inflation, by its rising price, or at least not a loss of purchasing power.
In 2013, the year the Fed said it would wind down QE and bond investors took a hissy fit, the rate on the 10-year Treasury at its highest point, ie., the worst for gold, was 3.04% on Dec. 31. 2013 inflation at its peak was 1.9%, leaving a real rate of 1.14%. Positive real rates generally will not move the gold price. A bond investor is still making 1.14% on his money even though inflation is taking away almost 2%.
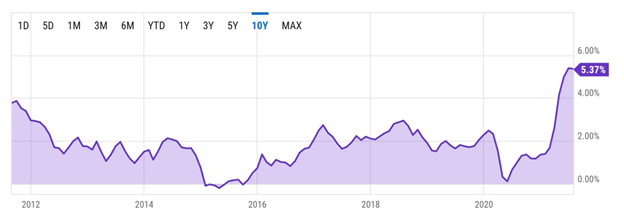
US inflation rate over 10 years. Source: YCharts
The current interest rate/ inflation environment couldn’t be more different. The unexpectedly rapid global economic recovery from covid-19 has demand for many goods and services outpacing supply. This has pushed US inflation from 0.12% in May, 2020, to the current 5.4%. For a few months the threat of inflation increased Treasury yields and thereby hurt gold prices, but not much has become of this trend. The current US 10-year sits at 1.27%, compared to 1.73% in March, and a very long way from 2013’s 3.04% and 2018’s 3.24% — a 10-year high. This puts the current real yield on the 10-year at negative 4.13%. Why would anyone buy a government bond when they will lose a net 4.13% to inflation and they could buy gold while it’s on sale at $1,780 an ounce? True, gold comes without a coupon but its track record is outstanding. In 1973 soon after being de-coupled from the US dollar, gold was trading at $70 an ounce compared to today’s $1,780, a growth multiple of 25X!
Debt
The debt-to-GDP ratio is an important metric economists use for comparing a country’s total debt to its gross domestic product (GDP). The percentage, arrived at by dividing the country’s total GDP by its total debt, indicates the country’s ability to pay back its loans. The higher the percentage, the higher the risk of a country being unable to pay the interest on its debt, and therefore defaulting on its debt.
Apart from telling us which countries are good and bad credit risks, the debt-to-GDP ratio can also help to predict the price of gold. As the ratio rises, either because of a drop in GDP due to a recession, or a jump in government borrowing that piles up debt, or both, the gold price reacts.
We see a positive, though fairly weak, correlation between gold and the US debt-to-GDP from 1970 until 2008. But the really big move, and the period we believe is most relevant to our current situation, occurred during the financial crisis of 2008-09.
During the rounds of QE conducted by the US Federal Reserve, starting in 2008, the Fed increased the money supply by $4 trillion. But there was also a massive fiscal stimulus package launched to get the economy moving again. Bailing out the banks cost $250 billion and the American Recovery and Reinvestment Act added $242 billion to budget deficits in 2009 and $400 billion in 2010.
We saw the debt-to-GDP ratio jump from 62% in 2007 to 83% in 2009, 90% in 2010, and it has kept climbing ever since.
The Fed’s balance sheet — the amount of assets it has purchased in the name of keeping the flatlined economy on life support — has risen to an unprecedented $8.2 trillion – way beyond anything the Fed did in the months and years following the financial crisis.
In 2013, the year of the taper tantrum, the Fed’s balance sheet was only about $3 trillion and the national debt stood at just $16 trillion, giving the central bank more room to maneuver than currently.
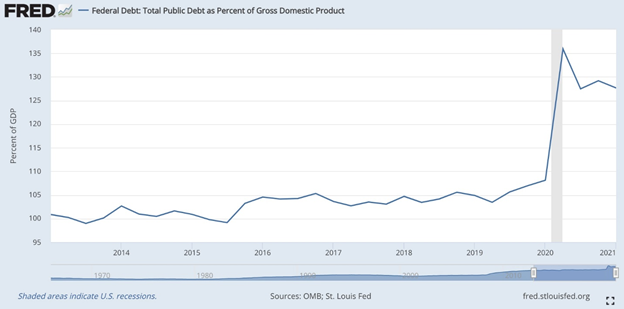
In October 2020, US debt zoomed past 100% of GDP for the first time since World War II. That means the amount owed is now greater than the size of the entire economy.
According to usdebtclock.org, the current national debt sits at $28.6 trillion, and it is increasing with each tick of the clock.
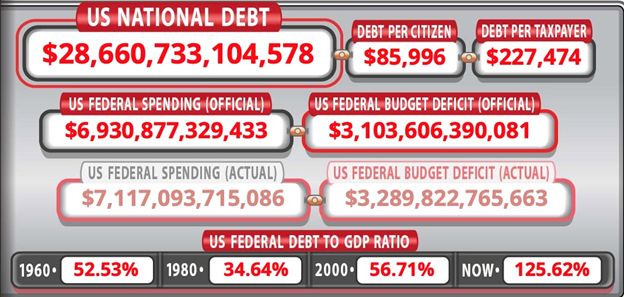
Source: usdebtclock.org
The next round of spending involves Biden’s $1 trillion infrastructure bill, just passed by the Senate but not yet approved by the House; and a $3.5 trillion anti-poverty and climate plan Senate Democrats hope to get passed this fall. The latter includes universal daycare, two free years of community college and expanded Medicare.
Debt is clearly a major limitation on a growing economy.
According to the World Bank, if the debt to GDP ratio exceeds 77% for an extended period of time, every percentage point of debt above this level costs a country 0.017 percentage points in economic growth. We are currently at 125.6%, so that is 48.6 basis points multiplied by 0.017 = 0.82, nearly a full percentage point of economic growth!
The current national debt of $28.6 trillion, and the current debt to GDP ratio of 125.6%, doesn’t include the $1 trillion infrastructure bill heading to the House; nor the $3.5T anti-poverty and climate plan.
We also have to add the federal budget numbers. President Biden’s budget for full year (FY) 2022 totals $6.011 trillion, more than any other previous budget. The US government estimates that for FY 2022, revenues will again fall short of expenditures, leaving a $1.8 trillion deficit. Better than the projected $3 trillion deficit for 2021 — almost the same as last year’s $3T — but it still means nearly $2 trillion will be added to the national debt. (CNBC notes the budgetary shortfall this year is equivalent to 13.4% of GDP, the second-largest level since 1945 and exceeded only by 2020 spending)
Adding it all up, you get $28.6T (national debt) + $1 trillion (infrastructure bill) + $3.5T (anti-poverty and climate plan) + $6T (FY 2022 budget spending) + $3T (2021 deficit) + $1.8T (2022 deficit) = $43.9T. So there you have it. By 2022 the national debt, presuming all of the spending commitments use borrowed (or printed) money, will be approaching $44 trillion!
The Fed is severely constrained in how much it can raise interest rates, to quell rising inflation, due to ballooning debt. Following $4.5 trillion spent on pandemic relief, and trillions more to come, through Biden administration spending, along with the continuation of quantitative easing (what I like to call “quantifornication”) to the tune of $120 billion in asset purchases per month, the Fed has in one year doubled its balance sheet to around $8 trillion and the national debt currently sits at $28.6 trillion.
Interest paid by the federal government this year on its debt is estimated at just under $400 billion.
Excessive money-printing not only in the United States, but Britain and the EU, is continuing to devalue currencies at an alarming rate (this, by definition, is inflation, because it takes more units of currency to buy the same amount of goods as before) — for which precious metals, namely gold and silver, is the best defence.
Economic uncertainty
The global economy in the years following the financial crisis did quite well, mostly as a result of loose monetary policies that started with the Fed’s first QE program in 2008.
As Investopedia notes, The US Fed, Bank of England, European Central Bank, Bank of Switzerland, and Bank of Japan have all proposed or attempted to taper or unwind their QE policies, only to subsequently renew and accelerate asset purchases and continue expanding their balance sheets.
For example the Fed Board in 2013 concluded that QE, which had increased its balance sheet to $4.5 trillion, needed to be scaled back. The tapering involved making smaller bond purchases through 2014, at a pace that was expected to reduce the balance sheet below $3 trillion by 2020. Instead, facing more negative reaction from investors, the Fed maintained its balance sheet at around $4.5T through early 2018. By 2019, market reaction to a mild pullback in QE resulted in an inverted yield curve which typically signals a pending recession. Once again, according to Investopedia, the Fed began accelerating its QE policies (by increasing its bond purchases), with assets exceeding $4 trillion in December 2019 and exploding over $7 trillion in early 2020, as fears of the coronavirus gripped the Fed.
The US economy has to some extend recovered from its awful 2020 with gross domestic product growing about 6.5%. Unemployment as mentioned at the top is falling and the manufacturing sector data is strong. However there are reasons to be cautious, even fearful, over the economic future.
In May MarketWatch ran the following headline: Dow jumps over 300 points to log 23rd record close in 2021 and S&P 500 ends back above 4,200 amid late-session surge. Today (Thursday) the Dow closed at 34,894.12, for a year to date gain of 15%, while the S&P 500 has managed a 19% increase. Just owning either of these indices without bothering to pick any stocks are heading for annual returns that most investors would be quite happy with.
And while the US economy continues to grow and seemingly thrive despite the huge anchor of debt weighing it down, we have to wonder how much of that is a base effect from last year’s horrible numbers. The national debt is $28.6 trillion and we know that every percentage point of debt above 77% costs a country 0.017 percentage points in economic growth. For the US, this knocks off almost an entire percentage point. How much longer can the economy keep growing at 6.5%? In my opinion less than a year, before growth levels off and drops to a more sedate pace.
We can already see signs of weakness. Bloomberg reported this week that consumer sentiment fell in early August to the lowest level in nearly a decade and US retail sales were lower in July than forecast. The total number of Americans working is still 5 million short of 2019 pre-pandemic levels. Employers say they’re having a hard time filling jobs, which points to another trend: a lot of people have dropped out of the labor force. This can’t be good for the economy.
The strength of the recovery is very much dependent on beating covid-19, but let’s take a look what’s happening with the Delta variant. USA Today published a map showing that cases are growing in 42 states and only shrinking in five states.
The country is experiencing a fourth wave of the pandemic as the disease spreads quickly through unvaccinated communities, with health authorities now recommending a booster shot to guard against the highly contagious Delta variant. There is also a disturbing increase in the number of “breakthrough infections” in fully inoculated people. According to the CDC, US hospitals are now admitting more than 11,000 patients a day with symptoms of covid-19.
Conclusion
The United States isn’t done with the coronavirus yet and we in Canada shouldn’t be smug about our relative success in containing the virus. On Aug. 11 CTV News quoted doctors who said Canada is now in a fourth wave too, with the bulk of new infections in BC, Alberta, Saskatchewan, Ontario and Quebec.
Between economic and political uncertainty in the US and Canada — the current Canadian election looks to be no more decisive than the last, with the governing Liberals losing popularity, and Trump’s followers still around and hoping for a re-match in 2024 — high inflation + low Treasury yields = negative real rates, and a huge debt overhang owing to continued quantifornication by the Fed and over-spending by the Biden administration, I’m not worried about a taper tantrum. We at AOTH continue to believe in gold and silver and are taking advantage of undervalued precious metals juniors, by taking positions in preparation for the next leg up.
Richard (Rick) Mills
subscribe to my free newsletter
Ahead of the Herd Facebook
Legal Notice / Disclaimer
Ahead of the Herd newsletter, aheadoftheherd.com, hereafter known as AOTH.
Please read the entire Disclaimer carefully before you use this website or read the newsletter. If you do not agree to all the AOTH/Richard Mills Disclaimer, do not access/read this website/newsletter/article, or any of its pages. By reading/using this AOTH/Richard Mills website/newsletter/article, and whether or not you actually read this Disclaimer, you are deemed to have accepted it.
Any AOTH/Richard Mills document is not, and should not be, construed as an offer to sell or the solicitation of an offer to purchase or subscribe for any investment.
AOTH/Richard Mills has based this document on information obtained from sources he believes to be reliable but which has not been independently verified. AOTH/Richard Mills makes no guarantee, representation or warranty and accepts no responsibility or liability as to its accuracy or completeness. Expressions of opinion are those of AOTH/Richard Mills only and are subject to change without notice. AOTH/Richard Mills assumes no warranty, liability or guarantee for the current relevance, correctness or completeness of any information provided within this Report and will not be held liable for the consequence of reliance upon any opinion or statement contained herein or any omission. Furthermore, AOTH/Richard Mills assumes no liability for any direct or indirect loss or damage or, in particular, for lost profit, which you may incur as a result of the use and existence of the information provided within this AOTH/Richard Mills Report.
AOTH/Richard Mills is not a registered broker/financial advisor and does not hold any licenses. These are solely personal thoughts and opinions about finance and/or investments – no information posted on this site is to be considered investment advice or a recommendation to do anything involving finance or money aside from performing your own due diligence and consulting with your personal registered broker/financial advisor. You agree that by reading AOTH/Richard Mills articles, you are acting at your OWN RISK. In no event should AOTH/Richard Mills liable for any direct or indirect trading losses caused by any information contained in AOTH/Richard Mills articles. Information in AOTH/Richard Mills articles is not an offer to sell or a solicitation of an offer to buy any security. AOTH/Richard Mills is not suggesting the transacting of any financial instruments but does suggest consulting your own registered broker/financial advisor with regards to any such transactions
© 2005-2022 http://www.MarketOracle.co.uk - The Market Oracle is a FREE Daily Financial Markets Analysis & Forecasting online publication.