


Is a Bigger Drop in Gold Price Just Around the Corner?
Commodities / Gold and Silver 2021 Nov 26, 2021 - 03:41 PM GMTBy: P_Radomski_CFA

As expected, after the applauded increase, gold fell. But will it manage to bounce off the bottom or rather slide lower?
Today’s analysis is going to be all about gold, and for a good reason. Based on yesterday’s and Monday’s sessions, November is now a down month for gold. Please let that sink in.
Gold ended last week above $1,850, with almost everyone in the market cheering and making bets, on how soon gold will move above $1,900 and then rally to new yearly highs. It was after the completion of the inverse head-and-shoulders pattern, after all!
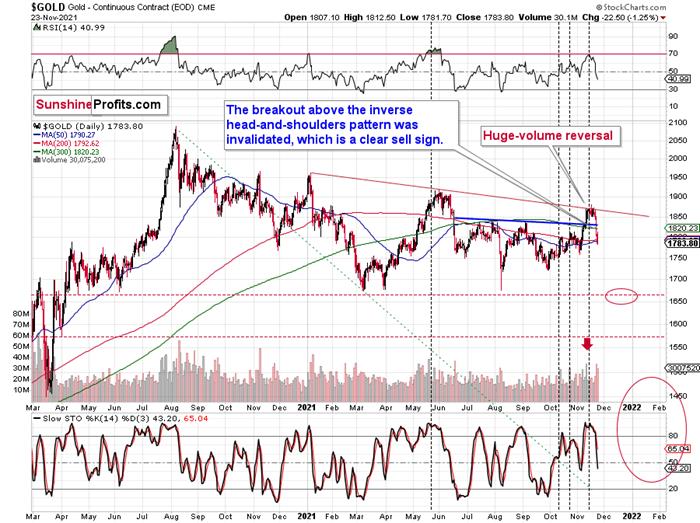
Well, I warned you that there were more long-term-based factors in place than the above-mentioned inverse head-and-shoulders pattern, and since longer-term patterns are more important than the shorter-term-based ones, the outlook was bearish, not bullish.
In fact, it was the very short-term rally that made the outlook bearish, because of three separate time-based indications for a reversal. And I don’t even mean other bearish indications like gold’s invalidation of the small breakout above the declining red resistance line.
Two of the indications that I described previously were the triangle-vertex-based reversals based on the below chart.
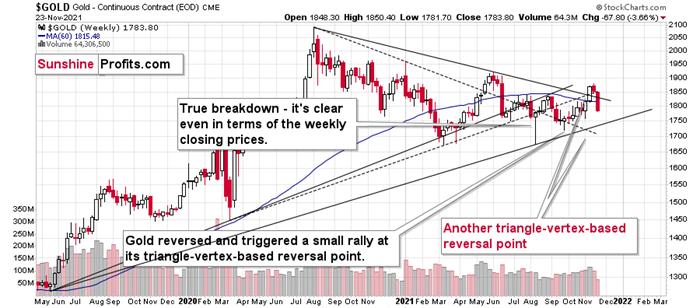
When resistance and support lines cross, markets tend to reverse their previous course. There’s no good logical explanation for why it should work, but it does. Not in every case, and I’m not promising that it will work in all cases, but I’ve seen it work so many times in the precious metals market so that I can say that ignoring these indications is a very costly endeavor.
Another indication came from gold’s long-term chart – its cyclical turning point was pointing to a major reversal, and the preceding move was up. Consequently, gold was likely to top.
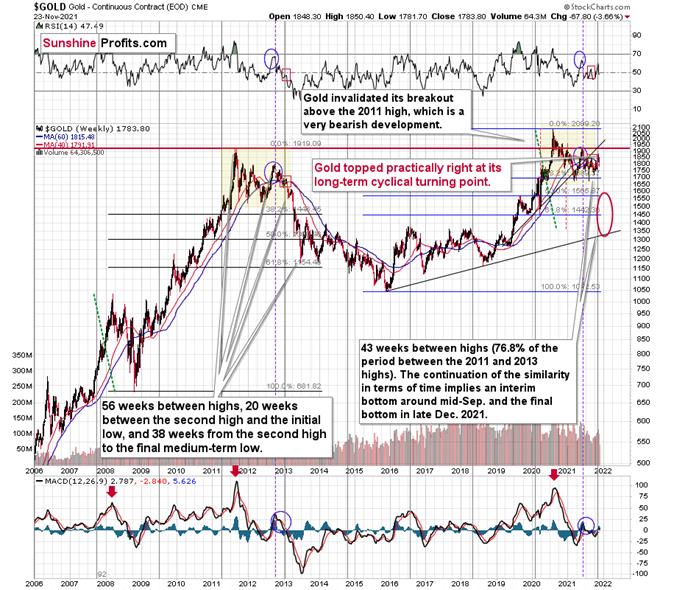
And that’s exactly what it did. Gold moved lower this week and taking into account the weekly high to yesterday’s closing price, it declined by over $100. Not bad for just two days.
But perhaps the most interesting things are now visible on gold’s monthly chart (based on monthly candlesticks).
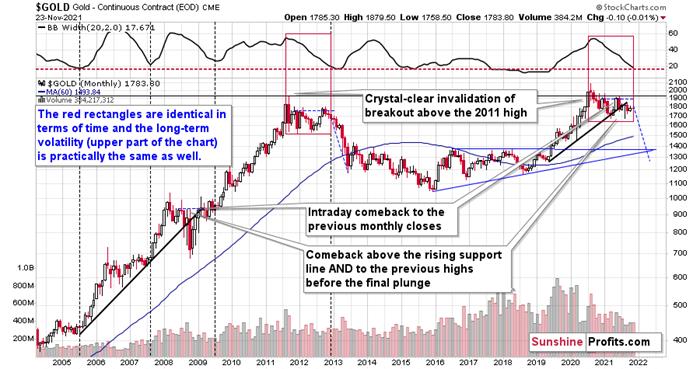
The above chart is loaded with clues. Let’s start with the similarity between now and 2013 that we see from this perspective.
The consolidation is similar not only in terms of the shape of the price move but also in terms of the decline in long-term volatility. The upper part of the above chart represents the width of the Bollinger Bands – a tool that is based on the volatility of the market. In short, greater volatility means broader Bands, meaning the above indicator would move higher. So, it’s essentially a proxy for volatility. Since we’re using monthly candlesticks here, it’s a proxy for long-term volatility.
Please note that the BB width not only moved from similar levels in 2011 and 2020 to similar levels in late-2012 and now, but it took approximately the same time to get there (if we start both moves with the final monthly high).
Like a Decade Ago?
The interesting thing about long-term volatility is that periods of low volatility tend to be followed by periods of high volatility – in either way. I marked four previous cases when we saw very low volatility after gold’s several-year-long rally, and it was indeed very close to the start of big moves.
One of those cases was the late-2012 case, which appears similar to what we see right now. Consequently, gold is likely to move quite significantly in the following months.
If the similarity to 2013 continues, gold would be likely to decline just as the blue dashed line suggests. This implies a move below $1,300. Will gold indeed decline to that low?
I doubt it, as there’s very strong support a bit below $1,400. It’s based on the previous highs and the rising support line based on the 2015 and 2018 lows.
The decline to those levels would have been enough of a reaction that was likely to follow the failed 2020 breakout above the 2011 highs. Invalidations of breakouts are strong “sell” signals, and invalidation of a breakout that was extremely important (as well as a breakout to a new all-time high), is likely to have very dire consequences.
Summing up, gold declined in tune with my long-term-based indications and the medium-term downtrend appears to have resumed. Based on the analogy to 2013 and other factors, a bigger decline in gold appears to be just around the corner (regardless of what happens in the very near term).
Today's article is a small sample of what our subscribers enjoy on a daily basis. They know about both the market changes and our trading position changes exactly when they happen. Apart from the above, we've also shared with them the detailed analysis of the miners and the USD Index outlook. Check more of our free articles on our website, including this one – just drop by and have a look. We encourage you to sign up for our daily newsletter, too - it's free and if you don't like it, you can unsubscribe with just 2 clicks. You'll also get 7 days of free access to our premium daily Gold & Silver Trading Alerts to get a taste of all our care. Sign up for the free newsletter today!
Thank you.
Przemyslaw Radomski, CFA
Founder, Editor-in-chief
Tools for Effective Gold & Silver Investments - SunshineProfits.com
Tools für Effektives Gold- und Silber-Investment - SunshineProfits.DE
* * * * *
About Sunshine Profits
Sunshine Profits enables anyone to forecast market changes with a level of accuracy that was once only available to closed-door institutions. It provides free trial access to its best investment tools (including lists of best gold stocks and best silver stocks), proprietary gold & silver indicators, buy & sell signals, weekly newsletter, and more. Seeing is believing.
Disclaimer
All essays, research and information found above represent analyses and opinions of Przemyslaw Radomski, CFA and Sunshine Profits' associates only. As such, it may prove wrong and be a subject to change without notice. Opinions and analyses were based on data available to authors of respective essays at the time of writing. Although the information provided above is based on careful research and sources that are believed to be accurate, Przemyslaw Radomski, CFA and his associates do not guarantee the accuracy or thoroughness of the data or information reported. The opinions published above are neither an offer nor a recommendation to purchase or sell any securities. Mr. Radomski is not a Registered Securities Advisor. By reading Przemyslaw Radomski's, CFA reports you fully agree that he will not be held responsible or liable for any decisions you make regarding any information provided in these reports. Investing, trading and speculation in any financial markets may involve high risk of loss. Przemyslaw Radomski, CFA, Sunshine Profits' employees and affiliates as well as members of their families may have a short or long position in any securities, including those mentioned in any of the reports or essays, and may make additional purchases and/or sales of those securities without notice.
Przemyslaw Radomski Archive |
© 2005-2022 http://www.MarketOracle.co.uk - The Market Oracle is a FREE Daily Financial Markets Analysis & Forecasting online publication.