


Gold Bullish Breakout Takes a Bearish Knock
Commodities / Gold & Silver Dec 07, 2008 - 09:25 AM GMTBy: Merv_Burak

 Okay. So maybe we're not yet in a roaring new bull market. The next level to watch would be the $700 level, if it gets that low.
GOLD LONG TERM - It's instructive to every once in a while take a look at a long term chart to see where we came from and maybe get a better idea as to where we might be going. I have two long term charts (other than P&F) that I usually show. This is my normal chart, one that I use in my weekly analysis. The other one differs in that it is more of a very long term chart and includes longer term indicators and moving averages.
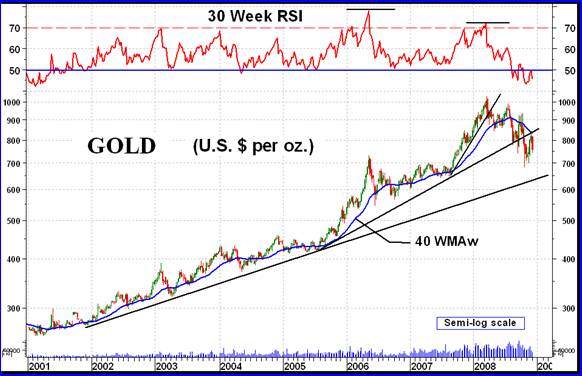
Without wasting much time in the past, here we see the negative divergence which was a long term warning of things to come. Also on the chart are my Merv's Bearish Accelerating FAN trend lines, the breaking of the third “blow-off” line was the start of the bear. Finally, we see the down side break of the moving average and momentum for another bear market signal.
At the present time we are in a conflicting status as far as the long term is concerned. Two weeks ago I showed the long term P&F chart and the bullish break-out on that chart, projecting to the $930 level. I did suggest that the break was a weak one and may not last. We are still within that bullish break-out pattern.
As for the normal indicators, they are all still bearish. The price of gold remains below its long term moving average line and the line remains sloping downward. The long term momentum indicator continues to be in its negative zone although it did try to rally back into its positive zone but didn't quite make it. If the bearish indicators remain in control then the previous P&F downside projections would also remain in effect, i.e. to the $480 level with a possible halt at the $630 level along the way. This level is very close to the initial FAN trend line and may be significant.
I like the P&F chart and the story it tells as it has rarely been wrong but at this time I am more inclined to go with the normal indicators and suggest the long term rating remains BEARISH .
INTERMEDIATE TERM
The sharp up move of a week or so back has all but been erased. I was wondering if it would be like the previous sharp up move of late Sept which went nowhere, topped out and made new bear market lows. We're not yet there with new lows so we'll just have to see how the next days and weeks pan out.
The week's activity did firm up the negative side of the indicators. The price of gold has once more dropped below its moving average line and the line slope is downward. The momentum indicator is heading lower inside its negative zone and below its negative sloping trigger line. The volume indicator, which has basically been moving in a lateral direction, continues to do so. All in all the indicators have turned around and turned the intermediate term rating back to the BEARISH camp.
SHORT TERM
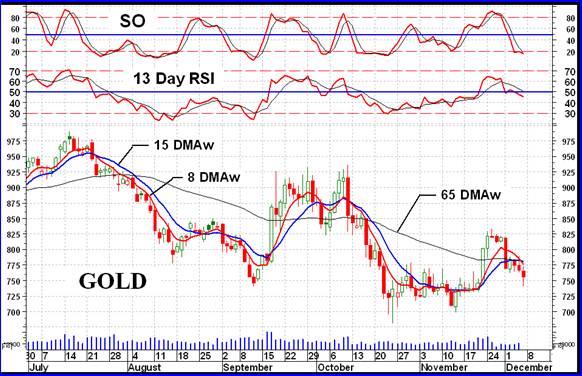
Well, the rally of the previous week didn't last long. We are once more in a short term down trend with everything following along. Gold is back below its short term moving average line and the line slope is back to the down side. The short term momentum indicator has dropped back into its negative zone and is below its negative trigger line. The trading volume in the gold futures remains low. To top it off the very short term moving average line has now dropped below the short term indicating the downward move is in control. The only rating I can give the short term is a BEARISH rating at this time.
As for the direction of least resistance, the trading during Friday afternoon was mostly to the up side but gold was stabilizing once more at the end of the trading day. Although nothing in the daily indicators suggests a reversal of direction to the up side yet I will go with a continuation of the intra-day trading to the up side on Monday.
SILVER
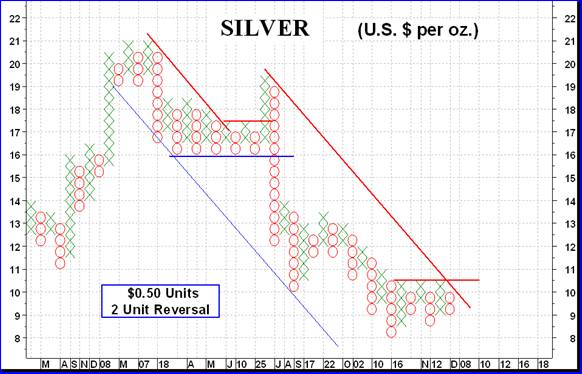
Although silver still seems to be under performing gold there are signs that its down trend has stabilized and it may be getting ready for a significant upside move. The P&F chart shows the consolidation and potential for an upside break. A move to $11.00 would confirm an upside P&F move in progress with a projection to at least the $17.50 level. Although a move to $8.50 would suggest new weakness it would take a move to $8.00 to confirm a continuation of the bear.
Looking at a bar chart and normal indicators we see that the past two months have been a basic lateral period for silver, its intermediate term momentum indicator and its volume indicator. A closer look at the indicators suggests that there is improvement in the internal strength of the silver move with the momentum indicator slightly more positive than strictly lateral. The volume indicator is also more positive with a slight upward tilt to its trend over the past few weeks. These may all be precursors to a solid new upside silver move or could just be confirmation of the idea that during a lull period speculators are more inclined to be on the buy side than the sell side, thereby affecting the indicators. Having said all that the indicators have actually dropped slightly during the week, enough to turn most of them back to the negative side. I have to downgrade the ratings for both the intermediate and short term to BEARISH for now.
PRECIOUS METAL STOCKS
It was another rotten week for the precious metal stocks. The “quality” silver stocks had an especially bad week although the speculative variety of silver stocks seemed to hold up better, if you call a 7.3% decline holding up. The sharp weekly decline posted by the Indices (see the Indices Table at the end of the commentary) did not seem to resonate with the momentum indicators. Although slightly lower during the week most of the momentum indicators have held up pretty well and remain some distance from their previous lows. Most Indices are either close to their lows or are making new lows. Looking at the Merv's Gold & Silver 160 Index we see the establishment of a “box” pattern with the Index trapped over the past seven weeks inside a narrow confine. This would be something to watch, the breaking out from this confine would probably tell us more as to the direction of the stocks than anything else would. With most Indices intermediate term momentum indicators inside their oversold zones the makings of a rally of some significance is more and more likely. However, we would have to wait for a move to be confirmed and not “jump the gun”, as it were.
Merv's Precious Metals Indices Table
Let's call it another week.
By Merv Burak, CMT
Hudson Aero/Systems Inc.
Technical Information Group
for Merv's Precious Metals Central
For DAILY Uranium stock commentary and WEEKLY Uranium market update check out my new Technically Uranium with Merv blog at http://techuranium.blogspot.com .
During the day Merv practices his engineering profession as a Consulting Aerospace Engineer. Once the sun goes down and night descends upon the earth Merv dons his other hat as a Chartered Market Technician ( CMT ) and tries to decipher what's going on in the securities markets. As an underground surveyor in the gold mines of Canada 's Northwest Territories in his youth, Merv has a soft spot for the gold industry and has developed several Gold Indices reflecting different aspects of the industry. As a basically lazy individual Merv's driving focus is to KEEP IT SIMPLE .
To find out more about Merv's various Gold Indices and component stocks, please visit http://preciousmetalscentral.com . There you will find samples of the Indices and their component stocks plus other publications of interest to gold investors.
Before you invest, Always check your market timing with a Qualified Professional Market Technician
Merv Burak Archive |
© 2005-2022 http://www.MarketOracle.co.uk - The Market Oracle is a FREE Daily Financial Markets Analysis & Forecasting online publication.