UK Inflation Forecast 2009
News_Letter / Inflation Jan 08, 2009 - 02:08 PM GMTBy: NewsLetter
 December 30th , 2008 Issue #43 Vol. 2
UK inflation for November as measured by the CPI continued its sharp decline, falling by 0.4% to 4.1% from the peak of 5.2% for Septembers data. The Bank of England would have been aware of the sharp fall in Octobers inflation at the earlier November MPC meeting that saw an near unprecedented panic interest rate cut of 1.5%, followed by a further 1% cut in December that has taken UK interest rates sharply lower from a peak of 5% in early October to stand at just 2% today. The interest rate cuts have been accompanied by BOE statements that UK economy is expected to contract by 2% GDP during 2009, that puts the UK on target to experience a worse recession than that of the early 1990's. However as my earlier analysis suggested that the UK could experience a decline of as much as 3% for 2009 which would make this recession just as bad if not worse than that of the early 1980's which wiped out much of Britain's manufacturing base.
UK Inflation Forecast 2009UK inflation for November as measured by the CPI continued its sharp decline, falling by 0.4% to 4.1% from the peak of 5.2% for Septembers data. The Bank of England would have been aware of the sharp fall in Octobers inflation at the earlier November MPC meeting that saw an near unprecedented panic interest rate cut of 1.5%, followed by a further 1% cut in December that has taken UK interest rates sharply lower from a peak of 5% in early October to stand at just 2% today. The interest rate cuts have been accompanied by BOE statements that UK economy is expected to contract by 2% GDP during 2009, that puts the UK on target to experience a worse recession than that of the early 1990's. However as my earlier analysis suggested that the UK could experience a decline of as much as 3% for 2009 which would make this recession just as bad if not worse than that of the early 1980's which wiped out much of Britain's manufacturing base. To counter the economic slump the Labour Government appears to have thrown all caution to the wind and embarked on a huge series of debt fuelled spending programs that are likely to witness UK public debt soar well beyond the 40% GDP limit, in fact taking account of the Bank nationalisations and capital injections public sector debt has already passed well above 50% of GDP to date. The consequences of unrestrained borrowing is potentially highly inflationary and manifesting itself in the crash of sterling that has plunged against major currencies by more than 30% as investors expect further interest rate cuts in the coming months that look set to achieve and possibly break below the 1% interest rate target, as the 6 months of paralysis at the Bank of England has been replaced by PANIC actions under direct government dictats to act. Therefore this article seeks to generate an accurate UK inflation forecast for for 2009 that takes into account the ongoing deflationary bust and the possible implication of inflation taking off during the second half of 2009 following the highly inflationary government borrowing binge as well as investment implications for 2009 and beyond. The Bank of England Inflation Forecast The Bank of England's inflation reports over the last 5-6 years have consistently forecast that UK inflation will hit 2% CPI in two years time, the same as the BOE forecast 2 years ago where UK inflation would be today, instead UK CPI inflation had soared to 5.2% for September's data. To date the Bank of England has only succeeded in hitting its inflation target for 5 months out of the 5 years that the BOE has been targeting 2% CPI inflation, the tendency has been for an average deviation of 0.8% from the Banks inflation target. Therefore this implies an inflation range expectation for 2 years forward of between 1.2% and 2.8% i.e. for inflation to either be significantly above the Banks target of 2% or significantly below the Banks target and is indicative of the continuing failure of the Bank of England to manage the UK's rate of inflation through the use of monetary policy which has contributed to the current severe economic bust. The most recent inflation report has deviated from the norm in suggesting that UK CPI Inflation will be at 1% in 2 years time and also fall to 1% by late 2009. However on past performance the Bank of England has consistently proven to be wrong in its inflation forecasts. UK Money Supply
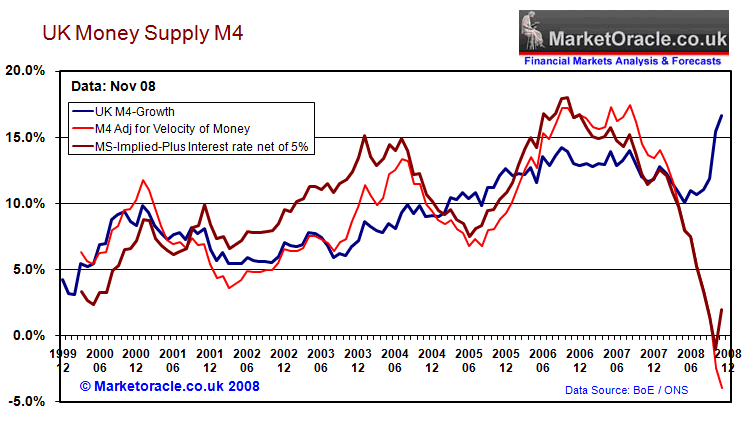
UK Money supply M4 (blue) has risen sharply from the 10% targeted low of mid 2008 to the current level of 16.6%, on face value this is highly inflationary and has been taken by many economists and market commentators to suggest much higher forward inflation. However the money supply adjusted for the velocity of money which takes into account the state of the economy as a consequence of the credit freeze tells a completely different story. The UK economy is now in extreme real monetary deflation of approaching -5%. The leading indicator of the implied money supply, is suggesting recent deep interest rate cuts of Novembers 1.5% and Decembers further 1% cut will lift future money supply growth out of extreme deflation, however it will still be far from supporting the levels north of 15% which accurately forecast forward inflation during 2008. In conclusion, whilst most economic data has yet to show the true face of what economic deflation is, however deflation is more than visible in the adjusted money supply data, which projects for a deflationary period for the whole of 2009 regardless of the headline growth of UK M4 money supply, that is being mistaken jumped on to signal hyper-inflation. The same applies to money supply data across the western world from the United States to the Euro block over to Japan, headline money supply data is misleading many market commentators into making false inflation conclusions. UK Producer Prices
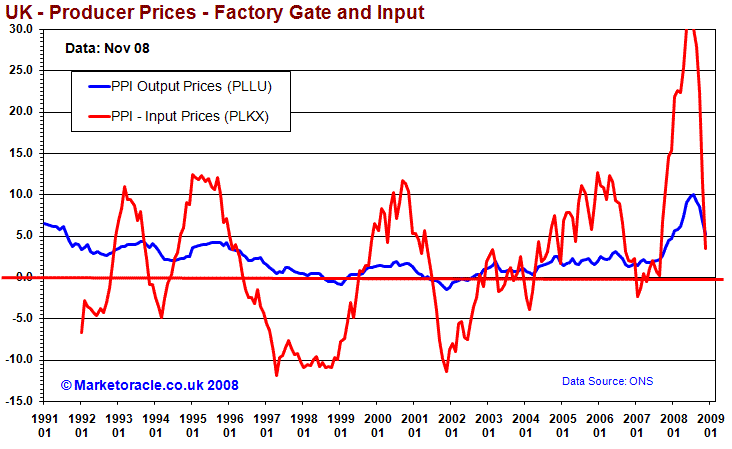
Producer price inflation turned sharply lower some 4 months ahead of headline inflation inline with the falls in commodity prices and confirmed expectations for sharply lower interest rates going forward. However the blinkered Bank of England obsessed over the CPI rate and thus failed to respond to the much lower forward inflation until interest rates were cut by Gordon Brown from the Prime Ministers despatch box on 8th October 2008. The PPI trends look set to turn negative on release of February data which suggests that the RPI and CPI inflation indices will continue to trend sharply lower for at least another 7 months before stabilising thus suggesting a July 2009 data inflation low. Crude Oil Price Deleveraging Deflation
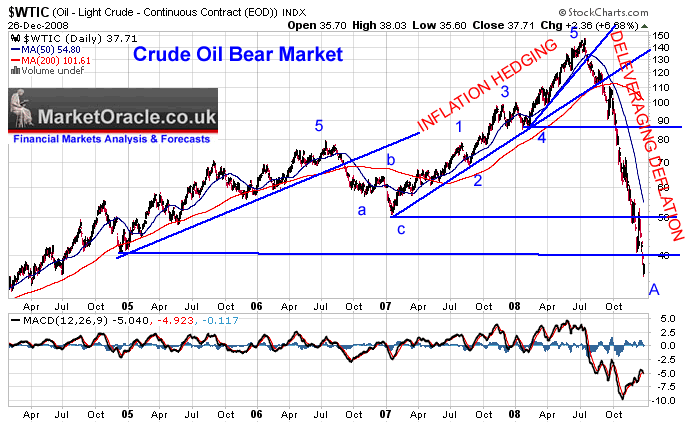
The crude oil bear market that caught most investors off guard that continued to clung on to bull market positions which have been all but wiped out continues its volatile price plunge by slicing decidedly below $40, trending down towards $30. China and other emerging markets are eyeing the fall in crude oil price to utilise huge trade surplus foreign currency reserves to buy up crude oil reserves exposure wherever possible, this has resulted in less of a decline for oil majors stock prices despite the 70% oil price crash. Crude oil as with all asset classes is being hit by the reversal of the inflation hedging that took place going into mid 2008 that saw crude oil bust through $100 towards $150, the original expectation was for the whole of this inflation hedging to unwind back through $100 and down towards a target of $80 with possible overshoot to the downside once the scale of the credit crisis fully manifested itself. As the oil price rally fed into much higher inflation statistics on the upside, so deleveraging of the inflation hedge is leading to self feeding deflation on the downside which is acting on pushing crude oils to much lower levels than could originally have been estimated. The deep recession ensures that crude oil demand is being cut faster than that taken up by the emerging economic giants of China and India, also the stronger dollar has ensured that the actual falls in foreign currency terms has been less for the UK than for the United States. This implies continued weak trend for crude oil for the duration of the U.S. recession which is the key to crude oils trend for 2009, which given last months job losses of 533,000, the worst data in 34 years illustrates that the U.S. economy is a long way away from recovery with Europe not far behind in terms of economic contraction and therefore precludes a quick sustainable recovery for crude oil prices. However as always traders and investors need to concentrate on the actual price trend rather than the economic data as the price will move long before a change in the economic fundamentals becomes apparent. Recent analysis Crude Oil Forecast 2009- Time to Buy? forecast a continuing crude oil weakness throughout 2009 targeting a double or triple bottom pattern that will include occasional price spikes higher, this confirms a continuing deflationary outlook for 2009. UK Housing Market Deflation
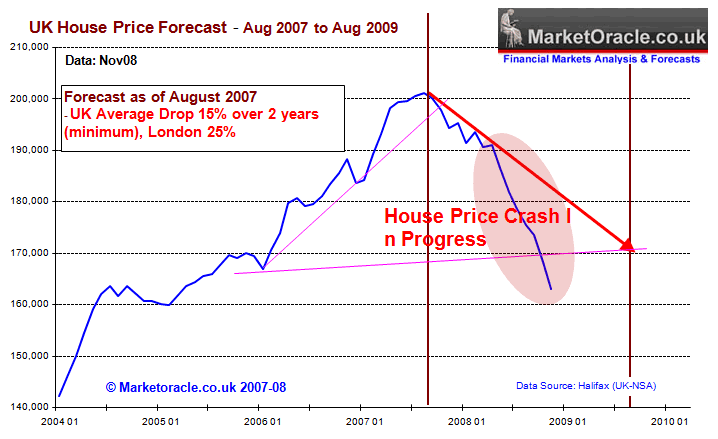
The Housing market has so far crashed by 20% form the August 2007 peak, as the boom made consumers feel richer with banks eager to lend on the back of mortgage equity withdrawals to fuel consumption so the crash in UK house prices, which is what we are witnessing is similarly leading to a contraction in consumer spending not seen since the early 1980's recession. People once in awe of watching their house prices rising on a monthly basis by more than their monthly wage are now experiencing house price falls of amounts in amounts far in excess of their salaries, this is creating a an increasingly depressive sentiment amongst home owners that is literally flooding out into the wider economy and acts as a feed back loop. The UK housing market leveraged debt fuelled pyramid is deflating as prices inflated to an average of X7 salaries, and in many cases above X10 salaries is crashing down to earth towards the long-term trend of X3.5 salaries which suggests that house prices have much further to fall, but more on this in the in depth housing market forecast update to be published later this week, subscribe to our always free newsletter to receive this in your email inbox. Credit Crisis Debt Deflation Readers do not need to be reminded of the credit collapse as by now everyone is aware of the bankrupt banks who's assets were in my view fraudulently inflated so that a bank officers could bank bonuses that accumulatively ran into the tens of billions that effectively left banks as mere hollow shells that increasingly declared ever larger quarterly losses in a policy of revealing as little as possible information to the investing public as possible without mentioning the fact that they were bankrupt long before the blowup of September 2008. Without repeating articles of the past, I refer readers to the analysis of 8th October 2008 which contained a breakdown of why the banks are going bankrupt. The consequences of the credit crisis for borrowers has been both the reduction in the availability of credit and much tighter lending criteria, this has brought to an end the debt fuelled spending binge of the consumer age, and therefore resulting in less demand for consumer goods as the retail sales section elaborates upon. For more on the credit crisis see the Free Credit Crisis Survival toolkit. LIBOR
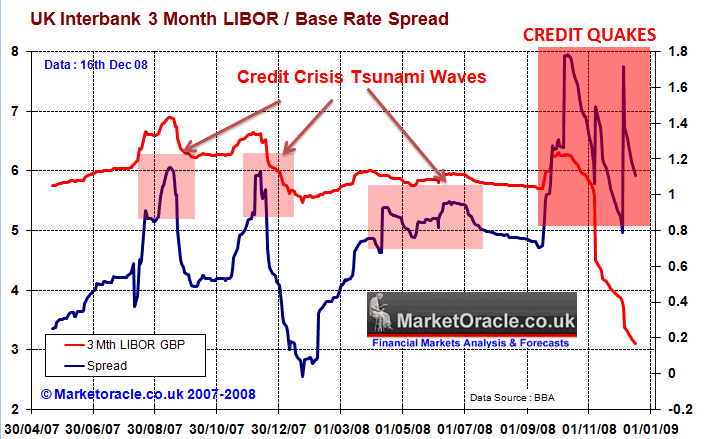
The LIBOR rate is critical to the health of the financial system and to that end the central banks of the world, UK included have pulled out all the stops to unfreeze the credit markets, unfortunately the LIBOR rate as reported by the British bankers association has long since stopped proving a reliable indicator of the credit freeze as the banks are NOT REPORTING THEIR REAL RATES CHARGED to the other banks to the BBA! BECASUE THEY ARE NOT LENDING TO OTHER BANKS. Thus the LIBOR is not as relevant to the state of the credit markets as it once was as I warned of as long ago as April 2008. However it is the only true measure of the interbank markets that we have. Even though effectively the central banks have taken over the roll of providing a market for interbank lending, which includes guarantees that extend to £250 billion. When the Bank of England first announced the £50 billion packages of loans to the banks in April 2008, I speculated that this would mushroom this year to £200 billion, an unheard of figure!, well scrap £200 billion, scrap£300 billion, even £400 billion the tax payer is now funding bank loans and capital on the unheard of scale of more than £600 billion, with more to flow during 2009. UK Crashing Interest Rates Towards Zero
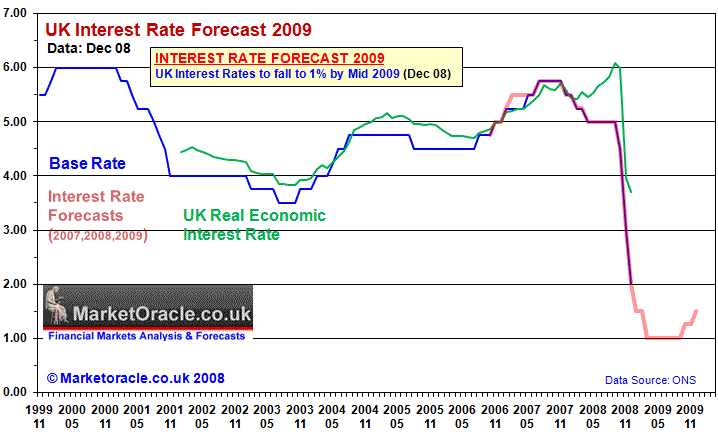
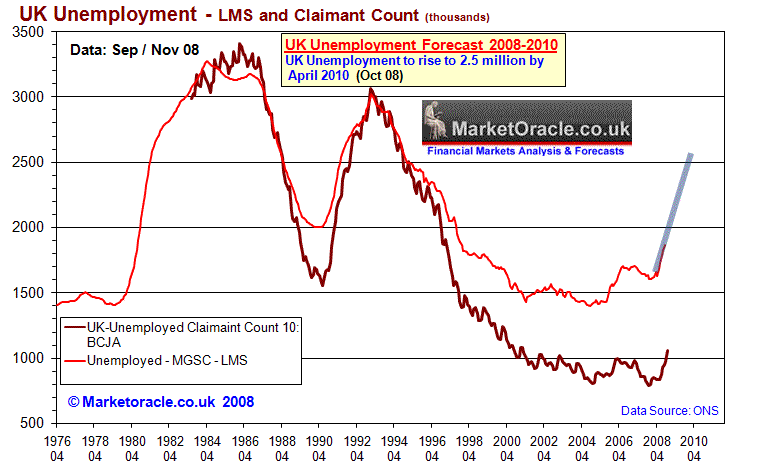
The government is engaged on a program of forcing the real economic interest rate lower by a series of deep unprecedented cuts in UK interest rates towards the target of 1%, and now possibly even lower. This is in an attempt at countering the economic downturn and to enable debt ridden corporations and consumers to be able to meet interest payments on debt the cost of which had soared during the credit crisis but is now starting to ease following the fall in the LIBOR rate to 3%. However whilst the rates have eased the liquidity and tighter loan requirements have not as the banks are seeking to hold on to government cash rather than loan it out in an atmosphere of increasing default rates. Also as the economy contracts the real economic interest rate has become less responsive to the base interest and hence the need for a much deeper cut than which would be required under normal circumstances. Credit Crisis Conclusion - The credit collapse is highly deflationary, this implies falling inflation for the life-time of the credit crisis, however all of the money printing is highly inflationary ONCE the credit markets unfreeze which in in my view is still a long way away i.e. beyond 2009, but the eventual inflationary effects do imply stagflation as the final bill will be added onto the governments official balance sheet as public sector debt. UK Economy The UK economy has fallen off the edge of a cliff, even the usually conservative Bank of England forecasts a 2% GDP contraction during 2009, my earlier estimates of 3% GDP contract appear to be right on the money, as the IMF this past week published their forecast for 3% UK GDP contraction.The UK economy is now contracting at its fastest pace since before 1945, and it remains to be seen if government measures to kick start the economy will succeed in bringing the recession to an end by the end of 2009, as a prolonged depression could see as much as 10% wiped off the countries GDP that will set the country back a further 5 years in terms of time taken to recover in real terms. Therefore the real rate of UK inflation which has tended to be some 3% above the CPI rate is falling at a must faster pace than the official inflation measures and is indicative of lack of sustained inflationary pressures during 2009. This therefore paints a picture of avoiding Britain as an investment destination for many years. Wage Deflation as Unemployment Soars UK unemployment crept up by 39,000 for September (3 month lag) to 1.864 million, and remains on target to break above 2 million on release of data for December 2008. The unemployment claimant count surged in November by nearly 10% to 1.056 million, up 86,000 on the month and confirming that the pace of unemployment is fast accelerating which compares against Octobers rise of 25,000 and September's rise of just 20,000.
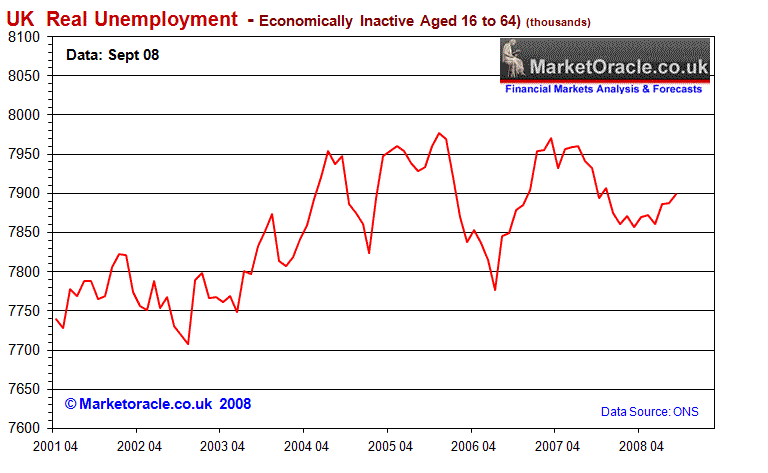
My original UK unemployment forecast is for unemployment to rise to a target of 2.6 million by April 2010, however the UK economy continues to deteriorate at an alarming rate with projections of a severe recession of more than a 3% GDP contraction during 2009 implies that the UK is heading for an unemployment rate that could pass above 3,000,000 , this despite the fact that the unemployment statistics are heavily manipulated to under report true unemployment which would be some 6 million higher if all those of working age (16 to 64) were included in the data. The real number of unemployed in the UK now stands at 7.9 million, up 12,000 in September as the below graphs illustrate.
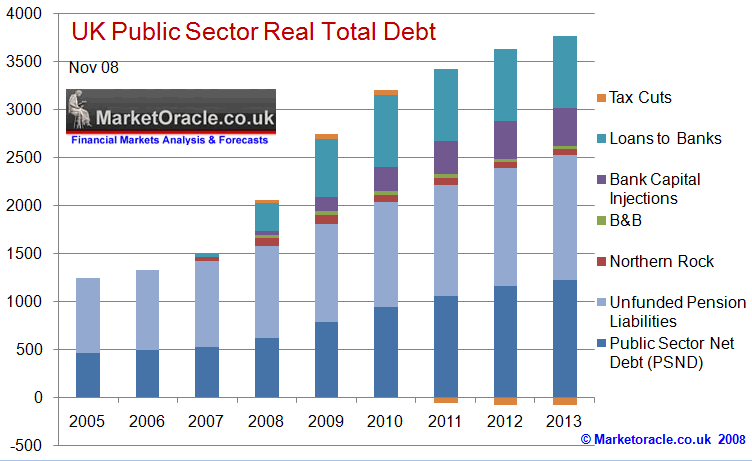
Rising unemployment and downward pressures on wages confirms a deflationary environment for the whole of 2009, as debt ridden consumers just do not have the cash in their pockets to ignite a wage price spiral that we saw during the 1970's. UK Government Deficit Spending to Win the Next Election. Gordon Brown is attempting to engineer an election bounce into the June 2010 deadline for calling a UK election. To this end government spending has already soared beyond the 40% GDP rule and already unofficially passed above 50% of GDP following the nationalisation of Northern Rock and Bradford and Bingley, soon followed by the £50 billion of capital injections. In total the credit crisis banking sector bailouts are expected to cost the tax payer some £250 billion over the next 12 months which equates to 20% of forecast GDP of £1.1 trillion. Government deficit spending is expected to soar during 2009 by a further £170 billion, as the GDP contracts by a further 30% the government will aim to fill the gap by borrowing for consumption rather than investment. This implies that UK debt is expected to increase by a further 30% of GDP by the end of 2009 and therefore not only break above 60% of GDP as forecast in April 2008, but also lift UK debt to above 80% of GDP. It remains to be seen what the actual official UK debt figures are as the government is expected to deploy slight of hand off balance sheet accounting practices to hide the true level of government borrowing, much as the bankrupt banks deployed to hide the extent of credit crash losses. However as the banks could not hide the losses from the financial markets which was reflected in the crash in share prices of more than 90%, similarly the Government cannot hide the real level of debt from the currency markets which has already seen a sharp fall in the value of sterling in advance of the surge in government borrowing.
Government deficit spending will continue into 2010 and right upto the general election deadline as the government will announce even more tax cuts and government spending programme's in an attempt to win votes. Therefore the first 5 months of 2010 could also witness another £100 billion additional debt, which would push government borrowing beyond 90% of GDP onwards and upwards towards 100% of GDP that will leave a huge inflationary hangover for many years following the 2010 election deadline. However the spending is not expected to leave much of a feel good factor as the country will still be in a deep recession, this raises the possibility of an much earlier election i.e. as early as March 2009, the consequences of which would imply less government borrowing as the spending surge would occur now and therefore be followed by a much tighter spending regime following an much earlier UK general election. UK Government Forcing Banks to Lend - The UK government has committed some £700 billion to date in an attempt to kick start the banking system, including strong armed tactics in an attempt to force banks to cut interest rates and restart lending. However the problem here is that as the debt bubble continues to implode the default rates continue to rise, and therefore make the banks teetering on the brink of bankruptcy less likely to lend. This suggests that at some point in the future the UK government will seriously contemplate taking over the liabilities of the whole banking system to the tune of £5 trillion and therefore a total nationalisation and control of the UK banking system that will be run with little regard to the ability of the borrower to repay the monies loaned i.e. the government will try to generate another debt bubble. The policies being implemented are akin to those adopted by a banana republic and not a developed western economy. The only way for the UK to overcome the growing debt mountain will be to inflate its way out of the debt crisis which means much lower sterling and higher forward inflation. British Pound Inflationary Crash
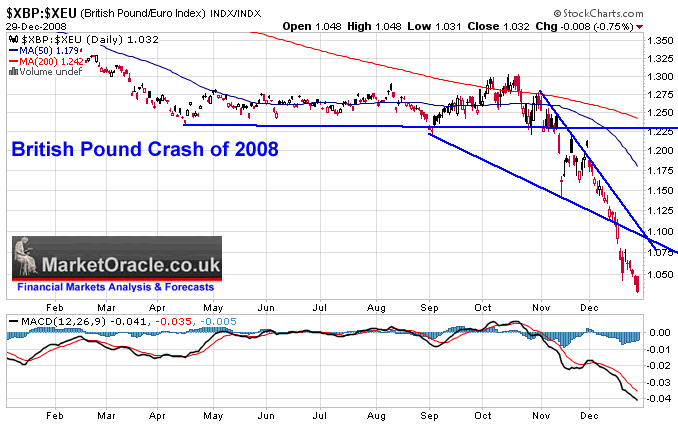
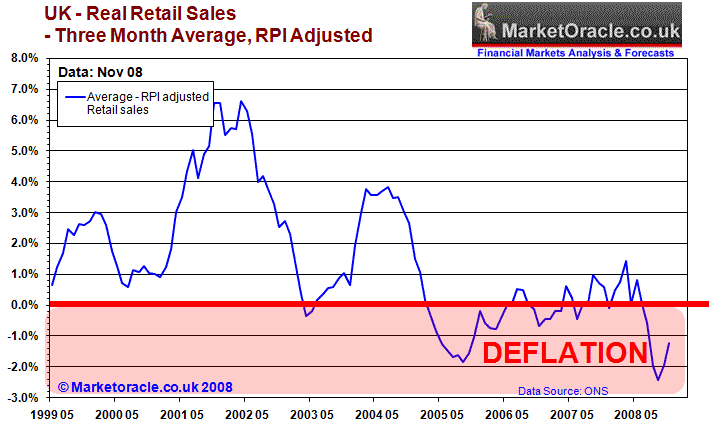
Sterling continued its Crash of 2008 following the bank of England's panic interest rate cuts of November and December by falling to a new low against the Euro, a whisker way from parity by trading below 1.03, similarly the British Pound has fallen from a high of 2.11 to just 1.46 against the US Dollar as investors and speculators continue to adjust to the deteriorating fundamentals of record low interest rates, economic depression and an exploding pubic sector debt burden that is likely to cripple the British economy for many years AFTER the recession of 2009. Already Bureau De changes are offering an exchange rate to the Euro of just 95. Sterling's bearish trend confirms that goods in the shops will not remain cheap for long and thus shoppers should take the opportunity to buy during the stock sales of the next month or so as the price for filling shop stocks later during 2009 will be significantly higher, as already holiday makers venturing abroad are experiencing the consequences of the crash in sterling. Retail Sales Deflation The trend and inflation adjusted retail sales data continues to represent the real state of the UK retail sales market that continues to deflate at a rate of -1.2% on a year earlier.
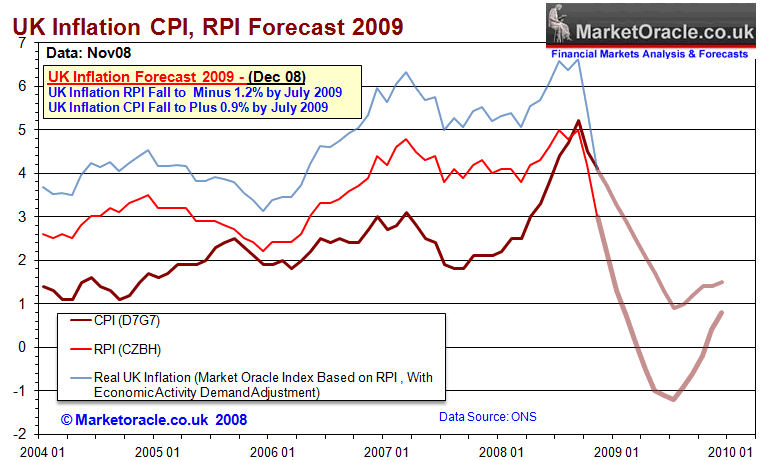
Retail sector deflation continues to claim major retailers as its most public victims to date include the major high street chains of Woolworth's , Zavvi and Adams, that are collectively expected to take some 50,000 jobs with them. It could be said that over Christmas and January retail sales activity 'should' rise, but not due to the healthy nature of consumer demand but rather due to deep discounting and the closing down sales that induce a short-lived bounce in retail sales volume that is expected to slump soon afterwards due to the disappearing retail sales space. That and our European and American cousins boost retail sales volume by benefiting from the 30% crash in sterling which means the already liberally advertised 20% discounts translate into a 50% discount for European shoppers, much as Briton's benefited not so long ago from the cheap shopping trips to New York at an exchange rate north of £/$2.00. However as earlier analysis suggested that the fall in sterling will result in much higher high street consumer prices during 2009 as those retailers that have not gone bust seek to replenish stocks at much higher prices during 2009. This again suggests that the January Sales for Britons may prove to be more illusionary than real as the fall in sterling has already soaked up corporate margins, which again confirms that those UK shoppers seeking to make large purchases are probably better off to do so sooner rather than later. This therefore sends out mixed signals for consumer prices later in 2009. Conclusion - UK Inflation Forecast 2009 The UK is heading for real deflation during 2009 as the below graph illustrates in that the RPI inflation measure is expected to go negative and spike lower around June / July 2009 as the RPI is sensitive to falling mortgage interest rates. The CPI will also continue to fall sharply into May 2009, which is targeting a rate of just below 1%. However the more money the government borrows as the difference between spending and tax revenues then the greater will be the eventual resulting inflation as there is no such thing as a free lunch, that will reverse many of the trends we have observed during the past 6 months and will continue to see during virtually all of 2009. However I am only expecting a mild up tick in inflation late 2009 due to the deflationary nature of economic contraction.
Therefore the conclusion is for UK inflation CPI to bottom at just below 1% by July 2009 and RPI inflation to bottom at -1.2% also by July 2009. Risks to the Forecast - At this point the risks to the forecasts are more to the downside than the upside, meaning that inflation could spike still lower during mid 2009 than forecast above. Government Inflationary Response to Deflation As mentioned earlier the Labour government has thrown all of the fiscal rules out of the window and has embarked on a debt busting inflationary programme of money printing. The Bank of England having first been paralysed into inaction despite overwhelming evidence that interest rates should be cut in an orderly manner towards a target of 3%. Having acted too late have now slashed interest rates from 5% to 2% in less than 3 months. With expectation of further cuts to take interest rates to the target rate of 1% and highly likely lower still. All of these actions reek of nothing short of panic to prevent an 1930's style deflationary depression. The consequences of which will be at the very least stagflation and if the level of incompetence continues than highly likely hyper inflation along the lines of the 1970's starting during 2010 and continuing for many years thereafter. Implication for Savers and Investors Savers- For over a year I have been banging the drum that savers should take the credit crisis opportunity of fix rates available at over 7% and to fix these for 2 years, these excellent rates were available right up to mid October, now the best rates are at around 5%, which is still significantly above the 2% base rate, What would I do now ? I would fix for 12 months as that would cover the deflationary period of the next 12 months that will continue to see savings rates fall sharply. Investors - 2009 the year for scaling into investments - Unlike savers, investors have plenty of time to scale into investments as deflation will continue to depress asset prices across the world, therefore commodities and stocks (with the exception of gold and silver) should see continued dollar weakness for much of 2009. What I am doing ? I am scaling into investments in crude oil, gas and agriculture commodities, each time these markets make fresh dollar lows, I accumulate more, with crude oil having hit $33 recently which is against a long-term, expectation of crude oil being north of $150 in some years time. Stock sectors to accumulate are in energy, materials and utilities, such as water and then the emerging markets, such as Brail, Russia, India and China, I do not know which will have performed the best in 5 years time, but clearly lower oil and commodity prices benefit india and China during 2009, whilst Russia and other oil producers continue to suffer, however much of this has already been priced into the respective stock markets, where the russian stock indices has crashed by over 70%, despite the fact that it was never as over priced as that of India and China was and this does fullfill my criteria of scaling into. UK Government Bonds - Those that took my cue to invest in government bonds have seen their investments soar as the Bank of England continues to target a trend towards 1%, however if the inflationary bust comes to pass then the first signs of this will be the downtrend in government bonds as yields start to rise in advance of higher inflation and interest rates. But for the meantime enjoy the UK government bond bubble that looks set to last into the second half of 2009 i.e. for the lifetime of the downward trend in inflation. Have a happy and prosperous New Year! Nadeem Walayat Copyright © 2005-08 Marketoracle.co.uk (Market Oracle Ltd). All rights reserved. Nadeem Walayat has over 20 years experience of trading derivatives, portfolio management and analysing the financial markets, including one of few who both anticipated and Beat the 1987 Crash. Nadeem's forward looking analysis specialises on the housing market and interest rates. Nadeem is the Editor of The Market Oracle, a FREE Daily Financial Markets Analysis & Forecasting online publication. We present in-depth analysis from over 150 experienced analysts on a range of views of the probable direction of the financial markets. Thus enabling our readers to arrive at an informed opinion on future market direction. http://www.marketoracle.co.uk Disclaimer: The above is a matter of opinion provided for general information purposes only and is not intended as investment advice. Information and analysis above are derived from sources and utilising methods believed to be reliable, but we cannot accept responsibility for any trading losses you may incur as a result of this analysis. Individuals should consult with their personal financial advisors before engaging in any trading activities. Attention Editors and Publishers! - You have permission to republish THIS article. Republished articles must include attribution to the author and links back to the http://www.marketoracle.co.uk . Please send an email to republish@marketoracle.co.uk, to include a link to the published article. For more in depth analysis on the financial markets make sure to visit the Market Oracle on a regular basis.
You're receiving this Email because you've registered with our website. How to Subscribe Click here to register and get our FREE Newsletter Forward a Message to Someone [FORWARD] To update your preferences and access the Newsletter archive [PREFERENCES] How to Unsubscribe - [UNSUBSCRIBE]
|
|||||||||||||
© 2005-2022 http://www.MarketOracle.co.uk - The Market Oracle is a FREE Daily Financial Markets Analysis & Forecasting online publication.


