


Gold and U.S. Dollar Trends Set to Diverge
Commodities / Gold & Silver 2009 Mar 15, 2009 - 08:19 PM GMTBy: Merv_Burak

 Both the US $ and the price of gold have been in a rally mode for the past few months. Both are now taking a rest. However, the big difference is that the momentum for gold is still quite positive while that for the US $ is most definitely weakening. Something's gotta give and my money is on the US $ continuing to slide from here and gold to turn around back to the up side.
GOLD : LONG TERM
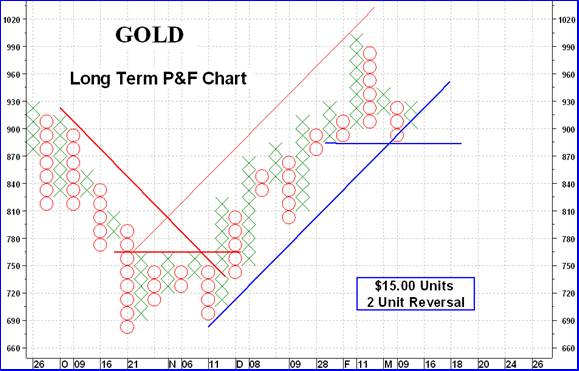
Since turning long term bullish in late November this P&F chart has stayed bullish. It has, however, provided us with a warning that if the next move should take the price of gold to the $885 or lower level then the P&F will turn back to the bearish side. At $885 the P&F would then be below the up trend line AND two previous lows, my two requirements for a trend reversal. The normal indicators are, however, not yet giving us any serious warning at this time.
Looking at the normal chart and indicators we see that gold price is still comfortably above its positive sloping moving average line. The long term momentum indicator is still well set in the positive zone although it is below its negative sloping trigger line. Although the volume indicator had been trending higher recently these past few weeks of downside price action has devastated the indicator. The volume indicator is trending lower and is below its long term negative sloping trigger line. Despite the weakening in the momentum and dollar indicators the overall long term rating remains BULLISH .
INTERMEDIATE TERM
Although we had the price of gold drop below its intermediate term moving average line it did bounce above the line by the end of the week. The moving average line itself remained in a positive slope throughout. Since the move started late last year we can draw an intermediate term up trend line (see the short term chart) with the latest action still above the line. A gold move to the $890 level would change a lot of things intermediate term wise. That would break below the up trend line, move below the moving average line and most likely cause the moving average to finally turn down. Should this happen it would most likely cause gold to continue lower and trigger the bearish long term P&F chart. So, it's a waiting game to see what is actually going to happen. The momentum indicator remains in its positive zone and has once more moved above its trigger line. The trigger, however, remains pointing lower. As for the volume indicator, it has moved below its negative trigger line and is a negative at this time. Still, at this time summing up the indicators I must remain BULLISH on the intermediate term.
SHORT TERM
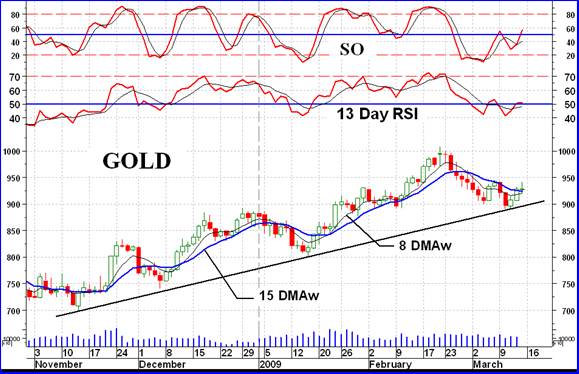
Although gold continued its slide earlier in the week it seemed to have found its support at the up trend line and bounced up. On Friday gold closed above its short term moving average line but the line slope remained negative. The short term momentum also moved above its neutral line into the positive zone with its trigger line turning upwards. The daily volume action could be a hell of a lot better so we need to watch this indicator. However, putting all the indicators together we are back into a BULLISH rating for the short term.
As for the immediate direction of least resistance, I would be inclined to go with the up side. Gold is above its very short term moving average line and the line is pointing upward. The moving average line has not yet moved above the short term line to confirm the short term direction so we may need to wait another day or so for that to happen. The aggressive Stochastic Oscillator (SO) has given us a warning of the upside bounce with its positive divergence versus gold price action in the past few days. The SO is now slightly above its previous peak from five days ago and is suggesting that the strength direction of the very short term movement continues to be to the up side.
SILVER
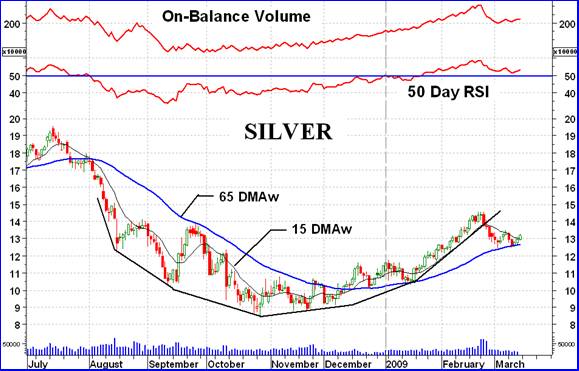
We have here what looks like a good example of a “rounding saucer” reversal pattern. These patterns take time to develop as this one has. It is not unusual in these patterns that when the right side of the saucer advances to almost the same level as the left side, it then takes a rest and moves sideways. This develops what technicians often refer to as a “handle”. The handle should not be very deep. The next move in this kind of pattern, once the handle is firmly developed, is to the up side. This next move should decisively break above the saucer tops and go into a good long term upside trend. At least that is what we are hoping will happen.
As for where the indicators are right now, looking at the intermediate term silver is bouncing off its moving average line and the line remains upwards. The momentum indicator, after a short reaction, has stabilized and remains above its neutral line in the positive zone. The volume indicator has taken quite a hit recently but also seems to have stabilized and once more is slowly turning upwards. I would still rate the intermediate term as BULLISH but seriously weakened by the past couple of weeks of activity.
On the short term silver is acting very much like gold except that the daily volume here is much lower versus previous periods and needs to show some upside strength.
PRECIOUS METAL STOCKS
After a couple of weeks on the down side it looks like the gold and silver stocks may have found a support. Looking at my universe of 160 stocks, the average price went nowhere this past week. The stock Indices with any movement on the up side were those which were heavily weighted towards the largest companies, and especially the foreign based companies. The FTSE African and Australian Gold Indices did quite well as did the Johannesburg Gold Index. Maybe it was primarily currency differences?
In my weekly list of the 25 top performing stocks for the various time periods it's interesting to see how they perform. Looking at the list of the 25 top short term performers, almost all have POS short and intermediate term ratings while looking at the top 25 intermediate term performers, their intermediate term ratings are still mostly POS while most of their short term ratings have gone NEG. What is the meaning behind this? I'm not sure but it's just a curiosity at this time. My guess would be that these top intermediate term performers have something going for them and are presently taking a break from their upside move. When the turn comes and they start moving upwards again the short term ratings will broadcast the start of the new move by going POS again.
Gold being the last refuge of those who wish to preserve their capital from the ravages of inflation, so the story goes, one must watch what is happening to inflation. One way to determine the potential for changes in inflation is to watch what is happening to the price of the US $. Although the US $ had a significant rally since last December making a new recovery high the momentum indicator has been giving us a serious negative divergence message. The strength behind the recent US $ move leaves a lot to be desired. The past few days have been negative for the US $ and I would not be surprised if this negative trend should continue, and maybe even go into new low levels below the 70 level. The US cannot keep printing money as it has recently without consequences.
This scenario for the US $ is, of course, a positive for the price of gold and therefore for the price of gold stocks. Despite the past few weeks of downside for stocks I don't think that is serious and the up side should soon take over once more.
Merv's Precious Metals Indices Table
Well, that's it another week.
By Merv Burak, CMT
Hudson Aero/Systems Inc.
Technical Information Group
for Merv's Precious Metals Central
For DAILY Uranium stock commentary and WEEKLY Uranium market update check out my new Technically Uranium with Merv blog at http://techuranium.blogspot.com .
During the day Merv practices his engineering profession as a Consulting Aerospace Engineer. Once the sun goes down and night descends upon the earth Merv dons his other hat as a Chartered Market Technician ( CMT ) and tries to decipher what's going on in the securities markets. As an underground surveyor in the gold mines of Canada 's Northwest Territories in his youth, Merv has a soft spot for the gold industry and has developed several Gold Indices reflecting different aspects of the industry. As a basically lazy individual Merv's driving focus is to KEEP IT SIMPLE .
To find out more about Merv's various Gold Indices and component stocks, please visit http://preciousmetalscentral.com . There you will find samples of the Indices and their component stocks plus other publications of interest to gold investors.
Before you invest, Always check your market timing with a Qualified Professional Market Technician
Merv Burak Archive |
© 2005-2022 http://www.MarketOracle.co.uk - The Market Oracle is a FREE Daily Financial Markets Analysis & Forecasting online publication.