


Using Elliott Wave to Enhance ETF Trading Returns
InvestorEducation / Learn to Trade Apr 02, 2009 - 09:04 AM GMTBy: Weekly_Wizards

 What‘s your intermediate-term view of the market?
We ended March on a good note, with the panic behind us. I do believe we're going to see some higher levels ahead.
Using Elliott Wave analysis and looking at the daily chart of the S&P 500, we see that the primary downtrend ended with the lows of March 9, which was the completion of the 5th wave down (Elliott Wave analysis counts in 5-wave sets).
Now we're in a new, secondary trend – a large countermove – up! I see this next set of waves, which began with the upleg in March, culminating in a move to the 1050 area over the next 3-5 months.
What about shorter-term?
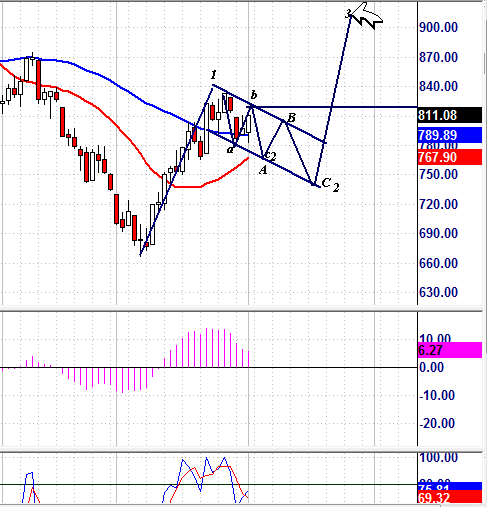
As I've mentioned, we've had a wave up in March, which I expect to be followed shortly by a down wave (wave 2 of this 5-wave set) that drags out anywhere from 2-3 weeks in a downward flagging pattern that takes the SPX to the 750-30 area.
On the Nasdaq, this could mean a turn at around the 31.00 level on the Q's (QQQQ) to 28.50 or possibly as low as 27.84.
That would be followed by what is typically the strongest wave of the set, Wave 3, that could see the S&P 500 trading up in the high 900s, possibly even 1000. See chart below.
How do you trade these trends?
We use the ProShares Ultra Index ETFs to trade these trends, typically as swing trades, using the QLD/QID to trade the QQQQ swings, the SDS/SSO to trade the SPX swings, and the DDM/DXD to trade the Dow. Right now we're long a half position in the ultrashorts of each of these three indices, looking to fill the other half on strength.
What rules do you follow in identifying waves?
Some of it has to do with Fibonacci retracement levels – i.e., support or resistance levels at which a stock tends to retrace a large portion of its original move before it continues in the original direction.
But there are some rules of thumb like I mentioned about Wave 3 being the strongest move. In addition, none of the prices in Wave 4 can overlap the prices of Wave 1. If they do, then you've counted your waves wrong, and are not, in fact, in the 4th wave. You may, instead, be in an ABC wave, a countertrend 3-wave move within a larger wave, where the rule is that the A and C waves are the same distance. These are just some of the rules that help us determine where we are in the wave trend.
On Monday you entered the DDM, SSO and QLD for a 1-day trade capitalizing on the upside. What gave you the signals to go long the market?
We gapped down on Monday, and I started seeing buy signals in the “smart money” charting I do. We have proprietary software that measures institutional block buy/sell volume, and when I saw the institutions very aggressive on the buy side when the indexes were falling, it automatically told me this was not going to last on the downside. We got into the trade with the SPX right around 785, and it ended up gapping up on Tuesday to 799.
Then on Tuesday, I started seeing the institutions selling up there, so we went short. We're taking advantage of this volatility in the market because we're able to see firsthand what's going on in terms of institutional buying and selling, and then from there piece together where we are in the wave structure. When both the charts and the volume indicators give a trade signal, and my other technical indicators are confirming, then we'll enter the trade.
We've gotten in and out on both directions pretty close to the bottoms and tops this week. It's giving us that easy gap down or gap up where we're able to lock in 4% or 5% at the open!
We see you've recently begun also trading the ultra financial ETFs? Why?
The reason is a lot of times we see the indexes either topping or bottoming, and we've found that the financials are either leading the way down or up. A lot of our members like using the ultra financials as a trading tool, because of how fast they move and how much can be made in a short time. I'm using it very carefully and believe the safest thing to do unless we see a big trend forming is to limit the trades to just the Direxion Financial Bull 3x Shares (FAS), which is the long side of the financials. There's just too much news that can come out overnight, especially with what's pending with the mark to market accounting rules for the banks, and if you're in the Direxion Financial Bear 3x Shares (FAZ), which is the inverse 3 to 1, you can wake up 20-30% down. That's why I'm very careful with those. If I see them bottoming and I see buy signals, it's something that's worth it.
The FAS had gone down from about 8 to all the way down to 4.85, and on Monday it was at an extreme where our software was calling for a buy. We were at support levels and were able to get in basically at the low, at 4.85. So the downside risk wasn't all that bad there, as we may have been looking at another 5-6% down. But the upside was 25-30%, which is a risk-reward opportunity we'll take anytime!
Gary Dean is author of MarketsPath.com, a live chat room and trade journal focusing on the ProShares Ultra Index ETFs, using the QLD/QID to trade the QQQQ swings, the SDS/SSO to trade the SPX swings, and the DDM/DXD to trade the Dow. Sign up for a Free 30-Day Trial!
http://www.advicetrade.com/Wizards
© 2002-2009 MPTrader.com, Weekly Wizards an AdviceTrade publication. All rights reserved. Any publication, distribution, retransmission or reproduction of information or data contained on this Web site without written consent from MPTrader is prohibited. See our disclaimer.
Weekly Wizards Archive |
© 2005-2022 http://www.MarketOracle.co.uk - The Market Oracle is a FREE Daily Financial Markets Analysis & Forecasting online publication.