


Instability & Depletion Add Uncertainty to Energy Sector
Commodities / Energy Resources Apr 03, 2009 - 07:57 PM GMTBy: Joseph_Dancy


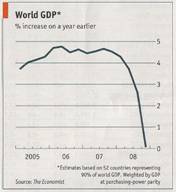 Energy use correlates closely with economic growth. Last month the World Bank forecast the global economy will likely shrink for the first time since World War II. International trade will decline by the most in 80 years according to the report, a stark trend in an economy that has been ‘globalized' over the last several decades.
Both the IMF and World Bank forecast developing nations will bear the brunt of the economic contraction as they face huge shortfalls to pay for imports and to service debts. “This crisis is the first truly universal one in the history of humanity,” a former IMF Managing Director.
Analysts note popular anger around the world is growing as a result of rising unemployment, pay cuts and freezes, bail-outs for banks, falling house prices, and the plummeting value of savings and pension funds. As people lose confidence in the ability of governments to restore stability, protests and social instability are increasingly likely.
Crude Oil Market / Political Instability - The Economist Intelligence Unit (EIU) issued a report last month that predicts the global economy will begin recovering in 2010 under their base case scenario. They assign a 60% chance for that scenario. Growth would be slow, but positive.
Along with their economic forecast the EIU calculates a ‘political instability index'. The 2009 base case identifies 95 countries with a ‘high risk of regime threatening social unrest'. Under the more dire economic forecasts, which they assign a 40% probability, the chance of instability increases.
In 2007 only 35 countries made the EIU's ‘high risk' list for political instability. Actual events proved that 66% of those countries experienced serious social unrest or instability—a very high back tested level of correct forecasts.
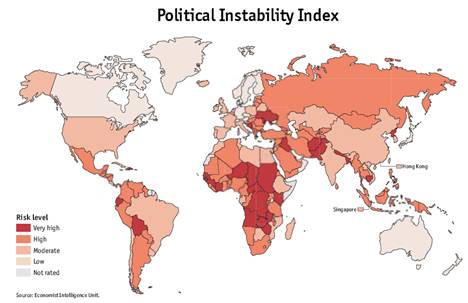
What the EIU report does not address, directly or indirectly, is the number of major crude oil exporting countries that are on the list of 95 countries with a high or very high risk of political instability.
Political instability may not result in regime change, but will add uncertainties to the export markets. Energy exports tend to be a focus of disruption in areas experiencing social instability.
Crude oil exporters on the list of those at high risk of political instability account for nearly 26 million barrels per day of production—a very high percentage of global petroleum output. Keep in mind globally we use roughly 85 million barrels of liquids per day, which is near the global capacity to produce. Seven countries were represented on the list. In addition the Ukraine, a country through which 20% of the natural gas consumed in the European Union, is included as a country with a ‘very high' chance of instability.
In sum, if the EIU's 2009 analysis is correct, and if it is as accurate as the back tested 2007 analysis, the probability of instability in an oil exporting country in the next 12-18 months is very high. Which will add another wildcard into the energy equation, increasing volatility – and investment challenges and opportunities.
Crude Oil Market / Depletion - In a stunning projection issued last month the International Energy Agency (IEA) sees a ‘massive fall' in Mexico's Cantarell Oil Field production in 2009. The field was the second largest producing field in the world a few years ago. It produced roughly 1 million barrels per day on average last year—a decline from 1.4 million barrels per day in 2007. In 2009 the IEA expects production to average around 600,000 barrels per day—a decline of 40% from last years production level.
Pemex, the field operator, is experiencing severe problems with natural gas and produced water production from Cantarell wells which results in well shut-ins and abandonment. Additional water separation units are expected to be installed on production platforms. Total Mexico production declined to a 13 year low last year and is expected to fall further in 2009 and 2010.
 With current crude oil prices around $45 substantial volumes of production will be shut-in or not developed according to analysts. Stanford Bernstein forecasts U.S. crude oil production will decline by 400,000 barrels per day next year if current crude oil prices remain in place. This figure is a bit high in our opinion, but the downward trend in production and tendency to shut-in wells is the correct analysis.
A separate analysis posted by a contributor to the Oil Drum a few weeks ago predicts world liquids production – crude oil, processing gains, and natural gas liquids – peaked a year ago in March, 2008. (See chart at right, TheOilDrum.com, http://www.theoildrum.com/node/5177 )
Depletion, which runs anywhere from 4% a year upward (note Cantarell's nearly 40% decline rate referenced above), reductions in capital expenditures, depressed energy prices, limitations imposed by the global credit crunch, nationalized oil fields, all will adversely impact future production levels.
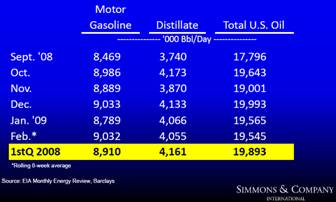
Matthew Simmons made an excellent new presentation last month on the outlook for the energy sector. He concludes crude oil supply will soon drop sharply as credit and pricing issues slow development to a crawl—and he also contends global demand for energy has not fallen as much as many assume (see chart of U.S. demand at right – the U.S. is the largest global consumer of crude oil).
Longer term Simmon's analysis confirms the bullish trends are still in place, global demand will continue to be robust while supply becomes more expensive to develop.
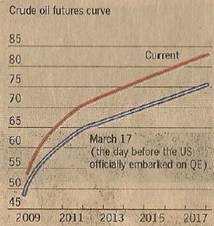
Crude oil futures remain in ‘contango' – a situation where the value in the future is much higher then at the present. Some analysts claim this is bullish for the commodity, an indication that the supply and demand for oil remains bullish. Companies can use this curve to hedge production from current reserves in the ground (chart courtesy Financial Times).
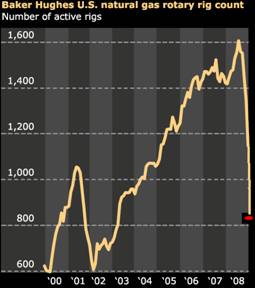 Natural Gas Market – Week after week we have seen significant declines in North American drilling activity—which you would expect with product prices at current levels. Last month the U.S. natural gas rig count fell to 810, the 18th weekly decrease and the lowest rig count since April, 2003 – six years ago. Since the peak last summer (at 1,606 rigs) the rig count is down 796 rigs, almost 50%, and continues to fall.
As noted in last month's LSGI Report with elevated depletion rates the current level of drilling activity will not replace production—and supplies and deliverability will suffer relatively quickly due to depletion. By the fourth quarter the Energy Department estimates U.S. natural gas supplies will decline by more than 5% - and will continue to fall as drilling is not replacing reserves.
The CEO of Devon Energy, Larry Nichols, notes "the drop in supply will be so steep, it could easily catch up to where demand has dropped to before the recession ends." We agree with his assessment.
 The last time drillers slowed drilling activity to this extent was seven years ago in the 2001 slowdown. Natural gas futures subsequently advanced 86 percent as supplies were adversely impacted. It took four years after the 2001 drilling slowdown for U.S. natural gas production to begin increasing again – it is difficult to reverse the trend once drillers step off the exploration treadmill.
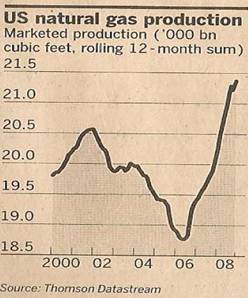
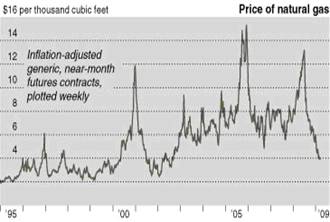
The charts at right illustrate the relationship between active rigs (top chart from Bloomberg) U.S. natural gas production volumes (middle chart from Financial Times) and futures prices (bottom chart from the New York Times). We tried to roughly correlate the time periods to illustrate the relationship between the rig count, production, and pricing.
Demand for natural gas has declined with the U.S. economy. Demand from the industrial sector is around 5% lower than year earlier levels according to the Energy Department. This sector accounts for roughly one-third of the market. Demand is not expected to increase in this sector until late 2009 or early 2010.
 Electrical generation is also down roughly 2.5% from year earlier levels according to data from the Edison Electric Institute. Summer demand for electrical generation is expected to be lower than year earlier levels, and natural gas storage should be easily filled to near capacity by summer end assuming no massive hurricane disruptions in the Gulf of Mexico.
As we enter the fall and winter months we expect trends in supply and demand will make it clear the oversupply relationship has changed. We expect prices to begin to firm from the current depressed levels at that point, if not in late summer.
By Joseph Dancy,
Adjunct Professor: Oil & Gas Law, SMU School of Law
Advisor, LSGI Market Letter
Email: jdancy@REMOVEsmu.edu
Copyright © 2009 Joseph Dancy - All Rights Reserved
Joseph R. Dancy, is manager of the LSGI Technology Venture Fund LP, a private mutual fund for SEC accredited investors formed to focus on the most inefficient part of the equity market. The goal of the LSGI Fund is to utilize applied financial theory to substantially outperform all the major market indexes over time.
He is a Trustee on the Michigan Tech Foundation, and is on the Finance Committee which oversees the management of that institutions endowment funds. He is also employed as an Adjunct Professor of Law by Southern Methodist University School of Law in Dallas, Texas, teaching Oil & Gas Law, Oil & Gas Environmental Law, and Environmental Law, and coaches ice hockey in the Junior Dallas Stars organization.
He has a B.S. in Metallurgical Engineering from Michigan Technological University, a MBA from the University of Michigan, and a J.D. from Oklahoma City University School of Law. Oklahoma City University named him and his wife as Distinguished Alumni.
Joseph Dancy Archive |
© 2005-2022 http://www.MarketOracle.co.uk - The Market Oracle is a FREE Daily Financial Markets Analysis & Forecasting online publication.