


Robert Prechter Current Stock Market Bear and Crash Calls
Stock-Markets / Stocks Bear Market Nov 05, 2009 - 09:11 PM GMTBy: EWI

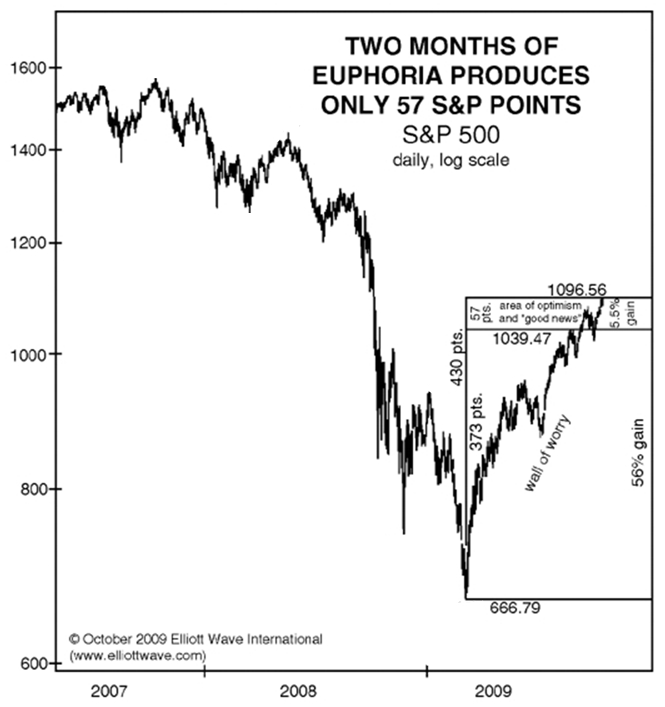
 Eight months ago, the stock market began a very large rally -- the gains exceeded 60% in the S&P 500. Everyone knows this. But here's a fact that has gone virtually unreported: The vast majority of those gains (about 90%) were from March through August. By comparison, September and October were sluggish.
Yet the past two months have been the very time when the financial press has been the loudest about "green shoots," "recovery" and "new bull market." So the question is WHY -- why so much enthusiasm, even as the evidence literally fades away?
No one asks questions like this, never mind provides the answers. The one exception is Bob Prechter. And if most investors suddenly DID learn the details of his answer... well, the information would buckle their knees.
Prechter does of course provide a detailed answer in his current Elliott Wave Theorist. The latest Elliott Wave Financial Forecast expands on that answer. You can read both award-winning monthly market letters right now for free!
But let me be clear: The answer is in fact a forecast. What Prechter says is bigger and more important than these two publications. It could prove to be the most important forecast he has offered since the financial debacle began.
This moment -- today -- is the time to put yourself on the path to safety. You can now download Prechter's latest monthly market letter, The Elliott Wave Theorist, and its sister publication, The Elliott Wave Financial Forecast -- for free. Together, they provide critical analysis for the Dow, Nasdaq, S&P, gold, silver, bonds, U.S. dollar, the economy and more.
This amazing opportunity runs for a full week. It ends Wednesday, Nov. 11.
Learn more about FreeWeek, and get your free reports here.
Here's a sneak peak inside these two timely issues.
October 2009 Theorist | What's Inside?
- 14 eye-opening charts across 10 analysis-packed pages for today's most critical markets: U.S. stocks, gold and the U.S. dollar.
- One chart you will NOT see elsewhere: It depicts a beautiful -- and telling -- fractal form in the past two years of market action.
- Mounting evidence from trusted technical indicators: sentiment, advance/decline ratio and volume.
- A decennial pattern in U.S. stocks that's held true for 10 of the past 11 decades.
- An informative and useful section titled "Devising Trading Strategies."
- Two and a half pages of gold analysis -- why lessons from the past likely provide ironies for the future.
- Poignant analysis for the U.S. dollar.
November 2009 Financial Forecast | What's Inside?
Special Section: The November Financial Forecast includes an eye-opening special section on Goldman Sachs. These new insights about one of Wall Street's most storied firms have broad implications for Wall Street as a whole. You will see a picture of Goldman's history plotted along a 100-year chart of the Dow. You will also learn how the same sentiment driving the market today will drive the course of mega-deal makers in the future. This is a can't-miss special section.
Plus, you will get:
- A thorough Elliott wave perspective on the stock market today -- what does Elliott tell us about the current juncture?
- A telling bar pattern candlestick aficionados will recognize.
- Valuable momentum considerations, including powerful evidence from a technical analysis method that tracks the distribution of stock from strong hands to weak.
- A chart of dollar trading volume vs. GDP and the important analysis about it that you should see now.
- And much more.
What's more, these are just two of the incredible free resources you get during this week only. You will also have completely free access to the most recent Theorist and Financial Forecast archives (September and October issues for each publication are currently available.) as well as the tri-weekly Short Term Update, which is designed to keep EWI's subscribers up to date between the monthly issues above.
Please don't delay. This special, limited-time offer from EWI is one of the most valuable free offers we've ever written to you about. It expires Nov. 11. Please follow the link below; sign up to join FreeWeek for free; print out your free reports; read them at your leisure. Do not miss this exciting opportunity.
Learn more about FreeWeek, and download your free reports here.
About the Publisher, Elliott Wave International
Founded in 1979 by Robert R. Prechter Jr., Elliott Wave International
© 2005-2022 http://www.MarketOracle.co.uk - The Market Oracle is a FREE Daily Financial Markets Analysis & Forecasting online publication.