


UK Inflation Forecast 2011, Imminent Spike to Above CPI 4%, RPI 6%
Economics / Inflation Jan 24, 2011 - 12:41 AM GMTBy: NewsLetter
 The Market Oracle Newsletter
Jan 17th, 2011 Issue #1 Vol. 5
UK Inflation Forecast 2011, Imminent Spike to Above CPI 4%, RPI 6%Inflation Mega-Trend Ebook Direct Download Link (PDF 3.2m/b) Dear Reader The last UK inflation data came in at CPI 3.3% and RPI 4.7% for November 2010, with real inflation at just above 6%, this is set against a continuous mantra in the mainstream press by pseudo economists / journalists that high inflation of above 3% was always just temporary and that it would resolve in a sub 2% rate by the end of the year (2010). Now a year on the same people that had misguided their readerships for virtually the whole of 2010 into avoiding inflation protection strategies that the coalition government has proceeded to strip away during 2010 such as scrapping of the RPI linked Index Linked National Savings certificates in June 2010, and are only now warning their readership's of the consequences of persistently high inflation that looks set to continue during 2011. This is set against my in depth analysis and concluding inflation forecast of December 2009, that UK inflation would spike to above 3% early 2010 and remain above 3% for virtually the whole year as illustrated by the below forecast graph (27th December 2009 UK CPI Inflation Forecast 2010, Imminent and Sustained Spike Above 3%).
The implications of high inflation for the economy and financial markets were further elaborated at length in January 2010's 100 page The Inflation Mega-trend ebook (FREE DOWNLOAD) that contained 50 pages of analysis and 50 pages of wealth protection strategies to protect and grow ones wealth during a sustained period of high inflation which would be used by the UK Government as the primary mechanism to stealth tax and erode the value of UK debt. One year on the Inflation mega-trend continues to gather momentum which means that the wealth protection strategies are just as valid today as they were in January 2010, that I will continue to update the status of during 2011. Bank of England Inflation Propaganda Reports 2010 High UK Inflation that has apparently surprised everyone to the upside for virtually the whole of 2010, by spiking and remaining above 3% from early in the year illustrates the tendency of the mainstream press to basically regurgitate the views of vested interests that beat the drum of always imminent DEFLATION for the whole of the year as High inflation was always just temporary and should be ignored by the general population. To look at the reason why high inflation has been ignored during 2010 we have to look beyond journalists, we have to look beyond academic economists that are paid to follow a school of thought that their pay masters want to push in the media. The place to look for the reason why high Inflation was ignored throughout 2010 is to the very top of the financial pyramid, to the Bank of England. The connection that the mainstream press has never been able to make is that the Bank of England does NOT make Forecasts. Instead the Bank of England quarterly inflation forecast reports are nothing more than ECONOMIC PROPGANDA, that virtually always converge towards the Bank of England achieving its 2% Inflation target in 2 years time, despite the fact that historical analysis shows that the Bank of England FAILS in achieving its 2% target 96% of the time. The following are the four quarterly Inflation forecast reports by the Bank of England issued during 2010 that were instrumental in academic economists and journalists in the mainstream press regurgitating the always temporarily high inflation mantra during 2010. Bank of England February 2010 Inflation Report
UK Inflation by Feb 2010 had as I anticipated spiked to above 3%. However the Bank of England's Feb 2010 Inflation Report forecast the spike as being temporary and to imminently to resolve in severe disinflation to target a rate of below CPI 1% by November 2010, instead UK Inflation for Nov is 3.3%. Bank of England May 2010 Inflation Report
The May 2010 Inflation report continued with the mantra of temporarily high inflation that would resolve in a rate of about 1.7% by the end of 2010, on the basis of spare capacity in the economy, the blatant flaw in the Bank of England's argument was the fact that much if not all of the spare capacity had been destroyed during the Great Recession of 2008-2009. Bank of England August 2010 Inflation Report
The mantra of spare capacity, downward pressure on wages to resolve in disinflation continued in the August 2010 Inflation Report. However now with most of 2010 gone, The CPI target for 2010 was revised higher to 3% from 1% (Feb 2010), with CPI for 2011 forecast to again resolve in CPI 1%, and a sub 2% CPI in 2 years time. Bank of England November 2010 Inflation Report
The Bank of England's most recent Inflation Report (November 2010) now forecasts UK CPI Inflation to target an early 2011 peak of 3.5% before inflation falls to below 2% CPI by the end of 2011 to target a rate of approx 1.7%, and for inflation to remain well below 2% into the end of 2012, therefore supporting the Bank of England's persistent view that everyone should focus on the Deflation threat and ignore high inflation during early 2011 so as the Bank of England can continue to keep interest rates well below the real rate of inflation for the purpose of funneling savers and tax payers cash onto the balance sheet of the bailed out banks. The 2010 Bank of England Inflation reports clearly illustrate the persistent trend as was the case for virtually every preceding year in that the Bank of England ALWAYS FORECASTS SUB 2% INFLATION in 2 YEARS TIME. The Bank of England wastes millions of pounds each year on producing worthless forecasts, the Coalition Government should save this money by instructing the Bank of England to scrap its economic forecasting units. Clearly the Bank of England relies on the gold fish memory of the mainstream press as the BoE seeks to revise inflation forecasts every quarter to always push forward sub 2% to two years forward, which is nearly always preceded by a trend to below 2% one year forward. In reality the quarterly inflation reports are just propaganda aimed at psychologically managing the populations expectations on the economy and inflation in the direction of where the BoE wants it to be, as the alternative would be to make the BoE's job harder. For instance if the Bank of England had stated that UK Inflation would be above its 3% target throughout 2010 then that would have ignited a wage price spiral that would have made the Bank of England's job at controlling inflation significantly harder, therefore it is much more convenient for the Bank of England to be seen to be wrong in its inflation forecasts than to attempt to accurately publicise probable inflation expectations. For instance if the Bank of England was not expecting high inflation during 2010 and beyond then why did the Bank of England's own staff pension fund switch from being 30% invested in inflation index linked government bonds to 70% during late 2009 ? More here - The Real Reason for Bank of England's Worthless CPI Inflation Forecasts As expected, the Governor of the Bank of England continues with the mantra of ALWAYS temporarily high inflation even as the UK stands at cusp of a further spike higher in UK's Inflation Mega-trend towards breaking above CPI 4%. The facts are that the evidence clearly shows that the Bank of England HAS LOST CONTROL of INFLATION! (Perhaps it was never in control of inflation in the first place, just lucky to have benign economic conditions during the early Labour years). Nothing illustrates the deflation delusion more than the following UK CPI Inflation index graph, which shows that the much hyped of Deflation during the Great Recession of 2008-2009 that academic economists still cling to has turned out to be nothing more than a mere inconsequential blip along the path of the Inflation Mega-trend (Free Download).
Perhaps its time for the Bank of England to come clean and confess that it no longer targets inflation but rather nominal GDP so as to give the illusion of economic growth. After all £200 billion of QE IS INFLATIONARY that the BoE itself instigated so as to inflate asset prices so as to inflate the economy. Off course the Bank of England has screwed it up because as well as inflating the economy they have inflated consumer prices well beyond the 2% target. But as long as the economy is weak the BoE will NOT risk a double dip recession by trying to reign in high inflation. Global Deflation Delusion Continued Throughout 2010 The deflation delusional fed by the worlds central banks and magnified by the mainstream press that gets regurgitated in the BlogosFear continued throughout the whole of 2010, and most notably in the US, where academic's marched their readerships into a bond market slump as elaborated upon in August 2010 ahead of the crash, that concluded in the following USB forecast graph (26 Aug 2010 - Deflation Delusion Continues as Economies Trend Towards High Inflation), that forecast US 30 year bonds would fall from 138 to a target of between 120 and 115 over the next 9 months, a trend that has subsequently transpired, whilst the delusional deflationists looking in the rear view mirror at QE1 pegged their expectations on QE2 resulting in a bond market rally, though missing the whole point that QE2 would trigger PURCHASES at the SHORT-END of the yield curve (which the Fed would be buying) which would be financed by SALES at the LONG-END of the yield curve. This FACT has YET to dawn on delusional deflationist's.
The deflation delusional continues to persist, where deflationists call upon anything other than the rising inflation indices to support ideological based thesis such as constructing nonsensical arguments that deflation exists if consumer prices are compared against the price of gold price to imply that the INFLATIONARY rise in the Gold price is a manifestation of DEFLATION because when priced in Gold (which has risen) then many consumer goods have deflated in price, despite the fact that 99.999% of the worlds population's transactions for consumer goods and services are NOT conducted in gold and furthermore ignoring the fact that the rise in the gold price is a manifestation of INFLATION, as the price of GOLD INFLATES in virtually EVERY FIAT Currency. Further deflation propaganda fraud is perpetuated by academics and the mainstream press by pushing the low core inflation argument, though this has also risen sharply in recent months to stand at 2.7%. The basic argument here is that energy and food prices should be excluded when measuring inflation because off course everyone in the UK has stopped heating and feeding themselves. This is the drip, drip strip away anything that has risen that lies at the heart of the deflation delusion that amounts to nothing more than propaganda espoused by vested interests in the fiat currency, stealth inflation theft fractional reserve banking system. High Inflation Coming to the U.S. During 2011 The UK led the way in inflation during 2010 that many other economies such as the US and Euro-zone will play catchup to during 2011, thus it will be interesting to see what propaganda the deflationists come out with during 2011 to perpetrate none existant deflation as the following U.S. CPI inflation index graph clearly illustrates that US inflation has been on the rise since early 2009.
UK Inflation Forecasting 2011 The UK Inflation Mega-trend is entering its second year, with the trend firmly in motion, this years Inflation forecast is an easier exercise to undertake than last years which required recognising an important juncture and attempted to map out a new trend that had yet to materialise so no Inflation Mega-trend Ebook necessary for 2011. It does not take a genius to workout that regardless of what the Bank of England's quarterly inflation propaganda reports state, that UK CPI inflation can be expected to remain above the banks 3% target for the whole of 2011. Therefore the question mark now is how high will UK inflation spike even on the highly manipulated official measure of CPI, let alone the more recognised RPI and on the real UK inflation measure that currently stands at just over 6%. VAT 20% Inflation Time Bomb Explodes The VAT time bomb that has been ticking for the whole of 2010 exploded on 4th of Jan 2011 that will now likely result in an surge in Inflation to above 4% CPI and 6% RPI as I anticipated over 8 months ago during the general election campaign (05 May 2010 - Greece Economic Depression Resulting in INFLATION NOT DEFLATION Surge ) A post UK election VAT hike to 20% from 17.5% is near certain to bring in extra revenue of about £13 billion per year. This will have the effect of both spiking inflation sharply higher and maintaining the ongoing longer-term inflationary mega-trend, therefore I would not be surprised that following the implementation of a VAT tax hike that CPI spikes above 4% and RPI as high as 6%! Which would further discredit the Bank of England's mantra of "Don't Worry Folks its Only Temporary". I wonder how many ordinary UK citizens will still continue to believe the Bank of England's statements of temporary high inflation when they see Inflation of CPI 4%+ and RPI 6% in a few short months. Will they still be willing to accept wage hikes of 2% or even freezes, or will they start to demand ever higher wage rises to match surging inflation and thus feed the the wage price spiral, especially as real UK inflation looks set to break above 8%. Therefore the VAT increase alone continues to point to an imminent spike to above 4% CPI and above 6% RPI, very early in the 2011. UK Inflation and Crude Oil Whilst Gold bugs may connect rising prices with the Gold price, however where consumer prices are concerned Gold has zero impact. Consumer prices are in large part driven by food and energy commodity prices with Crude Oil as the King of all commodities for determining inflation trends. The below graph illustrates the trend for Crude Oil priced in sterling against UK CPI and RPI Inflation indices.
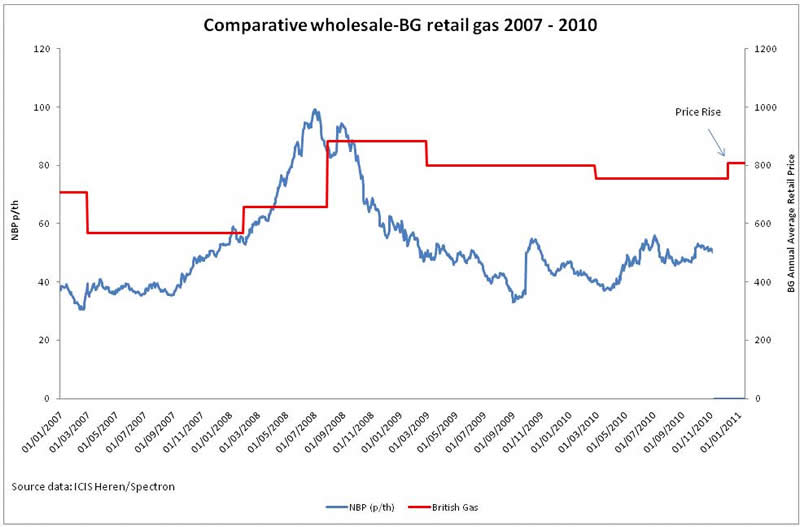
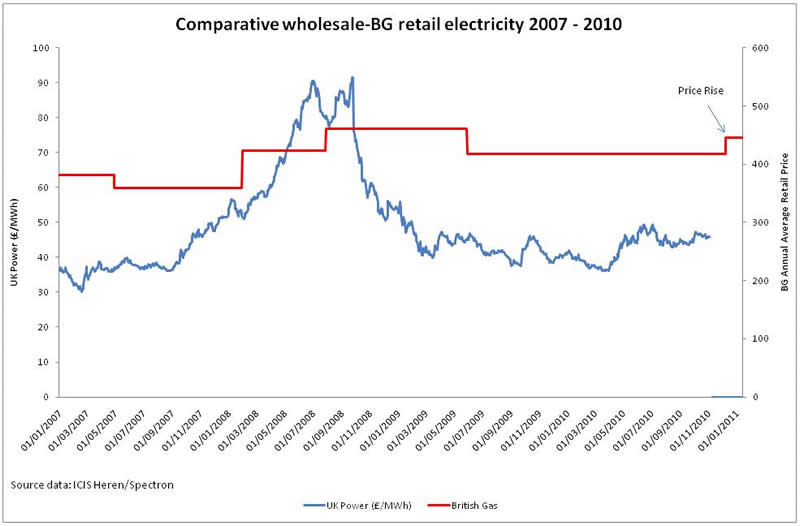
The graph shows a tendency for crude oil prices (in sterling) to act as a leading indicator for UK inflation of between 6 and 18 months. With normal expectations for a lead of between 6-12 months, depending on the overall state of the economy, which given that the UK economy is in recovery mode rather than in recession mode then the tendency will pull the lead against UK inflation nearer towards 6 months. The strong trend higher in crude oil during 2009 has resulted in high UK inflation throughout 2010. Crude oil during the past 12 months has manifested itself in a range with an upward bias of between 60 and 45, with the recent breakout in Crude oil signaling that 2011 is more than likely to see a continuation of the uptrend, though probably at a much shallower pace than during 2010, which is inline with expectations for sterling to firm against the dollar during 2011 and hence dollar price rises are expected to be more subdued when converted into sterling prices. Fuel Price Protests 2011 Crude oil prices are only part of the story as 2/3rds of the pump price is tax comprising of fuel duty and VAT. Therefore UK consumers are being hit by very large price hikes in petrol prices as VAT has gone up by 2.5% this month lifting petrol prices to a new all time high of above £1.30. With a further further duty rise of at least 4% coming in April 2011 that will act as a further accelerant on fuel price inflation that could again spark fuel protests during summer 2011 as last occurred in the UK during 2000. This suggests that UK CPI will receive several upward kicks during the year, which suggests an early year spike may be sustained into at least mid year as the coalition government seeks to tax consumers to death by lifting prices on demand inelastic commodities. British Energy Suppliers Ripping of UK Customers Whilst crude oil has trended strongly higher, subdued market Natural Gas prices could have offered disinflation hopes for UK energy consumers. Unfortunately the monopolistic energy companies that supply Britain's Gas and electricity have been ripping of the consumers by announcing price hikes in recent months of an average of 7% that is resulting in huge rises in profits of near 100% for companies such as British Gas (owned by Centrica). The British Gas price hike of 7% followed a 9.4% hike by Scottish and Southern which was followed by NPower's 5% and other providers that effectively operate as an energy supply cartel that allows them to charge monopoly profits on prices that do not reflect the market prices for gas and electricity as the following graphs by Consumer Focus illustrate:
British Gas and other energy providers are screwing the public by overcharging retail customers on Gas and Electricity by at least 40% even after allowing for an healthy profit margin as the British Gas price is 60% above the wholesale market price, which explains why British Gas profits have soared by 98%. The recent energy prices rises of 7% will put further upward pressure on UK consumer prices that coupled with the food price rises of 5.5%, virtually ensures that UK CPI inflation will spike above 4% over the coming months. Global Food Price Inflation The Inflation Megatrend ebook afforded investors an opportunity to protect their wealth by getting in at the very bottom of the food price inflation mega-trend during early 2010, which have subsequently soared in price as food commodity prices are starting to feed into global consumer price indices. Food prices during 2011 can continue to expect to deliver shocks to the upside as commodity prices target a break of the mid 2008 highs. Food Price Inflation Sparking Revolutions Whilst people in the developed world increasingly grumble at rising food prices that tend to be rising at levels at twice the official inflation indices, however in the developing world where average wages are typically less than 1/10th of that of the West, food inflation is pushing literally starving unemployed and low wage populations towards revolution against dictatorships and totalitarian regimes as we are today witnessing in Tunisia which was sparked by the food price protests, the momentum of which has led to the collapse of the regime. As high food price inflation persists then many more such regimes will come under pressure with even economic giants such as Totalitarian China not being immune to the consequences of populations that revolt against high food prices. Therefore expect more revolutions and countries such as China will attempt to export inflation abroad by revaluing their currencies higher which has the effect of boosting the value of foreign investments in China. British Pound and UK Inflation Virtually all of the worlds major commodities are traded primarily in dollars, therefore sterling's trend against the dollar is an important determinant of future UK CPI inflation trend. As with crude oil, the actual inflation consequences are delayed by between 6 and 12 months, since sterling has trended lower for the past 6 months by about 4%, then this is suggestive of some upward pressure on UK inflation during the next 6 months, though a 4% fall in sterling does not translate in a 4% rise in UK inflation. Sterling's recent fall at best adds approx 0.75% to UK CPI over the next 6 months, which therefore confirms that UK CPI is likely to spike above 4%, and the more currency sensitive RPI by more. To estimate the sterling impact on UK inflation during the second half of 2011, one needs to forecast sterling's trend into mid 2011. In this regard my last in depth analysis and forecast for the British Pound (04 Oct 2010 - British Pound Sterling GBP Currency Trend Forecast into Mid 2011 ) concluded in a forecast for sterling to target a volatile uptrend against the US Dollar to £/$1.85 by mid 2011 which represents sizeable 17% rally and therefore should the forecast transpire will act as a disinflationary force on the UK economy during the second half of 2011. Which suggests that the first half spike above 4% should resolve in a trend to back towards 3% during the second half of 2011.
Sterling's last close at £/$ 1.5850 shows a significant deviation from the forecast trend of about 4%, which should this trend persist then implies a higher trend path for CPI during the second half of 2011 that could remain above 4% CPI. At this point I still favour a trend towards the mid 2011 forecast target and therefore conclude on this analysis CPI being below 3.5% by year end. UK Public Sector Spending Cuts The following graph translates October 2010's announced cuts into spending department budget totals as phased in over the next 4 years (2014-15) after being indexed for inflation at 3% per year.
The graph shows that virtually every spending department will increase in nominal terms from 2009-10 to 2014-2015. Even budgets that have declared cuts of as much as 30% will barely see a nominal cut of 10%. The fact is that EVERY year total UK government spending will INCREASE, from £680 billion for 2009-10 to £739 billion for 2014-15, which is IF the government manages to achieve its spending cut targets as a more probable outcome is for far higher total government spending. Clearly the coalition government has made a huge mistake in ring fencing the NHS, which under Labour had seen out of control spending and when coupled with pensions virtually accounts for the total increase in government spending over the next 4 years. The reason why NHS unions and worker representatives are demonstrating against NONE Existant cuts is because the NHS is so inefficient as an institution that just to stand it still requires annual increases of 7-8%, therefore INCREASING the NHS budget by approx 4% per year has a similar effect as a 3-4% cut, which illustrates why urgent reform if not outright privatisation of the NHS is still necessary to prevent this spending department from bankrupting Britain, as the NHS spending black hole succeeds in undermining all of the other spending cuts put together. Coalition Government Using Inflation to Devalue Growing Debt Mountain As mentioned in the June analysis (29 Jun 2010 - UK ConLib Government to Use INFLATION Stealth Tax to Erode Value of Public Debt ) the spending cuts will not prevent total UK debt from rising over the next 4 years by 50%. This is as a consequence of the budget deficit that will persist into the 3rd year of the cuts programme as illustrated below, which anticipates the abandonment of the cuts programme during 2013 as the Coalition government gears itself up towards generating an election boom into May 2015.
Therefore despite much anticipation in the mainstream media, the actual spending review did not contain any real surprises that alter Britains' path towards a debt mountain total of £1,262 billion for 2013-14, an increase of 50% on the 2009-10 total of £784 billion that is following the same debt trend trajectory as under Labour's March 2010 Budget.
The impact of a 50% increase in total debt also implies at LEAST a 50% increase in ANNUAL debt interest payments towards £55 billion a year up from £34 billion for 2009-10, which also illustrates how clueless are those that argue the Coalition government is cutting too much too fast, when the alternative is a Greece / Ireland style crisis during 2011, resulting in the market demanding double or triple current interest rates for taking on the currency risk of lending to a country with an exploding debt mountain that it will NEVER repay in REAL terms as the debt burden would send inflation soaring and the currency plunging in an attempt at eroding the value of debt in real terms. This therefore continues to support the case of high UK inflation not just for 2010 or 2011, but for the next decade. Money Supply Adjusted for the Velocity of Money The mainstream press and academics obsess over headline M4 data (blue line) throughout 2010 that implied falling UK inflation that never materialised.
However as I voiced during each years inflation analysis and forecasts that the key to interpreting money supply data is to look at M4 adjusted for the velocity of money that during 2009 implied imminent extreme deflation that has come to pass and similarly for 2010 money supply showed the consequences of Quantitative Easing and near zero interest rates in that Money Supply adjusted for the velocity of money that bottomed from a crash into March 2009, and breaking higher on an accelerating trend that has continued into late 2010. This suggests that the Bank of England and majority of economists remain mistakenly fixated on the headline M4 which has nudged to below 5% and therefore continue with the policy of Zero Interest Rates and Quantitative Easing. The actual graph shows Money Supply adjusted for the velocity of money tapering off after a strong trend higher throughout 2010, and the MS Implied having surged to new highs which matches the actual UK inflation trend that contrast against weak M4. The trends for M4 Implied Adjusted imply expectations for UK CPI to trend in a range similar to 2010 during 2011 after the initial early 2011 spike. UK Retail Sales Deflation The adjusted retail sales data shows that Labour's debt fuelled economic boost to the high street soon evaporated during early 2010, with UK retailers coming under a great deal of distress continuing up to the latest data release of October 2010.
There is nothing to suggest that 2011 is going to be any better for UK retailers who are being squeezed by economic austerity, high inflation and the most recent VAT hike, clearly consumers are being squeezed hard which is making itself felt in the high streets which suggests a number of big name retailers could go bust during 2011. This continues to support the growing conclusion of an early 2011 inflation spike resolving towards Inflation targeting a similar trajectory as 2010 for the remainder of 2011. Retailers left standing after a potential 2011 blood bath will have little choice but the raise prices in line with RPI inflation to try and fight their way out of deflation so as to survive. UK Unemployment The fundamental flaw in the governments employment policy and OBR forecast for UK unemployment to hit 2 million by 2015 is the fact is that as many as 80% of the new jobs created by the private sector will go to E.U. migrant workers as identified in the UK unemployment forecast (01 Jul 2010 - UK Unemployment Forecast 2010 to 2015 ). The latest UK unemployment data is line with the forecast trend for UK unemployment to start rising in September and target a trend to 2.9 million by mid 2013 as illustrated by the below forecast graph.
The ongoing euro-zone debt crisis and resulting economic depressions in PIIGS economies is resulting in a huge number of migrant workers entering the UK workforce from especially Ireland, Greece, Portugal and Spain as identified recently (22 Nov 2010 - Ireland Bailout Consequences for Britain, Portugal Next? Stock Market Correction Over? ). Over 100,000 have migrated from Ireland alone over recent months which is set against total private sector job creations running at an average rate of about 30,000 per month, which illustrates that 80% of the new jobs are not going to be filled by UK unemployed citizens. The government in part is aiming to address the migrant workers issue by attempting to force those on benefits that can work but chose not to work off of benefits, although most of the measures will not be implemented for several years. The best response from job hunters to the weight of a rising trend in UK unemployment for several years would be to start thinking outside the box and contemplating self employment / business startups as the coalition government has promised to foster a more business friendly environment by cutting red tape. Meanwhile those that are employed continue to be squeezed by average increasing by just 2.2%, which is well below even the manipulated official inflation CPI measure at 3.3%, and half the rate of the more recognised RPI at 4.7%, which actual real inflation of 6.2% triple average earnings. The overall impact of rising unemployment is neutralised by migrant workers creating new demand and thus putting upward pressure on prices. UK Economy GDP Growth for Q3 of 0.8% was inline with my forecast of December 2009 (31 Dec 2009 - UK Economy GDP Growth Forecast 2010 and 2011, The Stealth Election Boom ) that forecast Q3 growth of 0.9% which is set against Reuters poll of academic economists the day before that forecast GDP growth of 0.4%. The below graph illustrates the forecast trend for UK GDP (ABMI chain linked at market prices, change on year earlier). The UK GDP Growth trend forecast was updated following the June Emergency Budget that resulted in a revision for 2011 growth from +2.3% to +1.3% (09 Aug 2010 - UK Economy GDP Growth Forecast 2010 to 2015).
As mentioned earlier, the Bank of England's actions as opposed to rhetoric suggest that the Bank of England no longer targets inflation but rather nominal GDP, given that the above forecast is for low economic growth over the next 3 years then that also suggests high inflation for the next 3 years. Stagflation - The Invisible Depression Low forecast economic growth of between 1% and 1.5% for the next 3 years plus high inflation of between 3% and 6% (CPI / RPI), implies there is enough margin for error in the GDP price deflator utilised by the government statisticians in estimating real GDP for there to be NO REAL growth for 2011-2013, which therefore means that the UK is entering a number of years of stagflation, the experience of which will be just as painful as the Great Recession of 2008-2009 as it will be mostly hidden from public view as the government hides behind phony statistics that imply growth and prosperity when REAL INFLATION ensures they will be losing just as much wealth if not more than they did during 2008-2009!. UK Inflation Forecast Conclusion This analysis concludes towards UK inflation spiking higher to above 4% very early during 2011, possibly as early as on release of January 2011 data during mid Feb 2011. However this spike is expected to subside with UK CPI inflation then targeting a down trend into the end of 2011 towards 3%, with Inflation effectively in a range of between 3% and 3.5% for the second half of 2011, as illustrated by the below forecast graph.
Risks to the Forecast That crude oil goes super nova and targets a break of the 2008 high of $150, which would add at least 1% to the forecast CPI trend for 2011. Another upside risk is if sterling takes another big tumble towards multi-decade lows and not forgetting the wage price spiral kicking in as the workers of Britain refuse to be lied to anymore about temporarily high inflation and start demanding wage rises in line with inflation. I see no downside risk to inflation because the Government wants / needs inflation so as to continue to monetize and erode the value of UK public debt. Protect Your Wealth Inflation is a stealth tax that is being used by the Government and the Bank of England to a. Reduce the budget deficit (eroding purchasing power), and b. funneling tax payers and savers cash onto the balance sheets of the bailed out banks as savers are in receipt of interest net of tax at half the CPI rate and similarly average workers pay rise is near half the CPI and far below the RPI inflation measure of 4.7%. At the end of the day savings/ capital taxes PLUS inflation are a means of taking accumulated wealth from the haves and redistributing to the have not's. Over the long run inflation ensures that those with accumulated wealth will ultimately lose most of it to the state (unless their funds are protected against UK inflation and taxation). Unfortunately the coalition government has accelerated the trend of stealth theft by withdrawing the National Savings Index Linked Certificates in June, that allowed the people of Britain to at least protect upto £15,000 (per issue) of their life time accumulated savings against RPI. Whilst also declaring a switch in annual indexation from RPI to CPI which means under reporting UK inflation by 1.5% against RPI and 3% against real UK inflation (6.2%). The Bank of England is going to keep printing money which is a positive for asset prices such as stocks. For investors the strategy remains to invest in inflation wealth protection and growth such as agricultural commodities, gold, silver, metals and mining, TIPS, emerging economies such as China, India, Russia, Chile, Brazil, and developed economies such as Australia and Canada as their appreciating currencies will protect your investments purchasing power in sterling as covered at length in the Inflation Mega-trend ebook (FREE DOWNLOAD). Implications for UK Interest rates My next analysis will seek to come to a trend conclusion for UK interest rates in light of another year of high above target inflation and try to answer the question will interest rates rise during 2011 and if so when and by how much. Ensure you are subscribed to my always free newsletter to get this analysis and forecast in your email in box as well as my next ebook on the Real Secrets of Successful Trading which will also be made available for free (Anticipated March 2011). Source and Comments: http://www.marketoracle.co.uk/Article25637.html By Nadeem Walayat Copyright © 2005-11 Marketoracle.co.uk (Market Oracle Ltd). All rights reserved.
Disclaimer: The above is a matter of opinion provided for general information purposes only and is not intended as investment advice. Information and analysis above are derived from sources and utilising methods believed to be reliable, but we cannot accept responsibility for any trading losses you may incur as a result of this analysis. Individuals should consult with their personal financial advisors before engaging in any trading activities.
You're receiving this Email because you've registered with our website. How to Subscribe Click here to register and get our FREE Newsletter To access the Newsletter archive this link Forward a Message to Someone [FORWARD] To update your preferences [PREFERENCES] How to Unsubscribe - [UNSUBSCRIBE]
The Market Oracle is a FREE Financial Markets Forecasting & Analysis Newsletter and online publication. |
||||||||||||||
© 2005-2022 http://www.MarketOracle.co.uk - The Market Oracle is a FREE Daily Financial Markets Analysis & Forecasting online publication.