


These 2 Charts Reinforce My Belief That We’ll Face A Recession In 12–18 Months
Economics / Recession 2018 Aug 23, 2017 - 04:51 PM GMTBy: John_Mauldin

 Stock valuations are the discounted values of future earnings. Future earnings depend on future revenue, which may diminish whenever the future includes a recession. So, broad economic conditions are a big factor to watch in stock valuation.
Broad economic conditions depend ultimately on the consumer’s ability and willingness to spend money. And July’s retail sales report gave us a peek at that.
Why Consumer Spending Is Still Low Compared to Previous Recoveries
Core retail sales rose 0.6% from June. The uptick was more than analysts expected, and most categories were up, too. The exceptions were clothing and electronics sales.
The latter may have to do with potential smartphone buyers waiting to see new iPhone models expected to debut this fall.
Peter Boockvar summed up the bigger picture:
Bottom line, after the slowest y/o/y core sales gain since March 2016 in June of 2.5%, they rose by 3.6% y/o/y in July, which is about in line with the 5-year average of 3.3%. This pace, though, still remains well below the 5%+ growth rates in the two prior recoveries. Here are some reasons why: Many consumers have jobs, but we know accelerating wage gains remain spotty; the savings rate is near the lowest level since 2008; and credit card debt, student loans, and car loans each total $1T+. Lastly, we know healthcare spending (high deductibles) and rent have dominated the budgets of many.
Consumer spending, at least according to this report, is up compared to the recent past but far lower than it should be at this point in the cycle. Peter mentions debt as one factor. The New York Federal Reserve Bank just updated its consumer debt chart, giving us an enlightening breakdown.
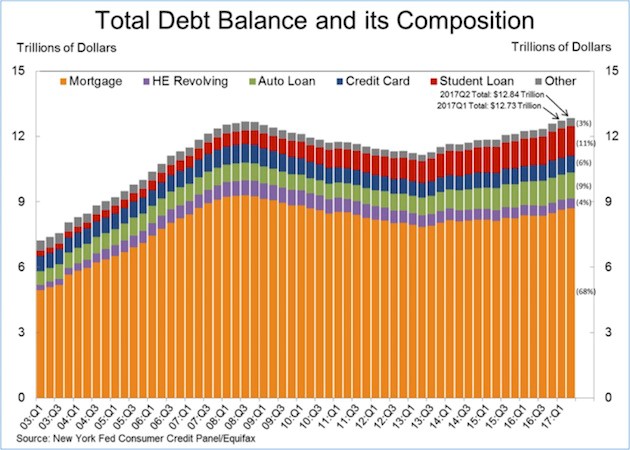
The bulk of consumer debt (68%) is still in residential mortgages. Balances have climbed in recent years but remain below the 2007 peak. Both auto and, most significantly (and perhaps ominously), student loan balances have grown enough to offset the lower mortgage balances.
Total debt is close to where it was at the beginning of the last recession.
Keep in mind also that debt totals don’t capture all the obligations a typical household faces. Vehicle and apartment leases, for example, don’t show up in this chart. But they are nonetheless monthly bills that consumers must pay.
That little omission might be important when (not if) the next recession strikes. This could be soon, if an indicator Michael Lebowitz uncovered proves reliable.
Growing Divergence Between Real Valued Added and GDP
Real value added is the inflation-adjusted version of gross-value added. Here’s how Michael explains it:
GVA is a measure of economic activity, like GDP, but formulated from the production side of the economy. It measures the dollar value of all goods and services produced less all the costs required to produce those goods or services. For example, if 720Global buys $100 worth of wood, $20 worth of other materials, and employs $30 worth of labor to build a chair, we have produced a good for $150. If that good is sold for $200, 720Global has created $50 of economic value.
Over time, GVA tracks nominal GDP closely, but they can diverge in the short run. That is happening right now. Three of the last four quarters brought Real GDP growth—albeit not much—while RVA was negative. RVA below zero, as plotted below, is closely associated with the onset of recessions.
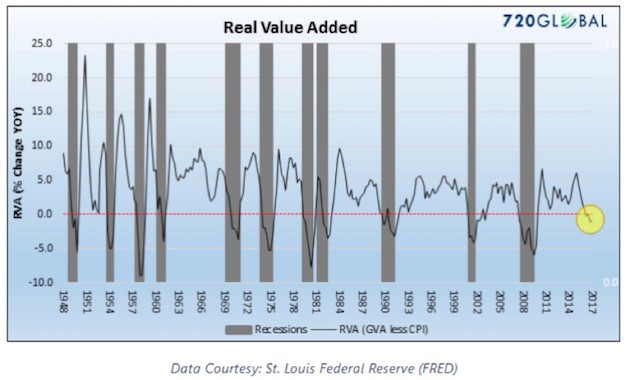
This measurement technique is a little offbeat, but it is intriguing. Maybe this time is different, but we know from all kinds of other data that a recession should strike soon—by which I mean that one is quite possible in the next 12–18 months.
Join hundreds of thousands of other readers of Thoughts from the Frontline
Sharp macroeconomic analysis, big market calls, and shrewd predictions are all in a week’s work for visionary thinker and acclaimed financial expert John Mauldin. Since 2001, investors have turned to his Thoughts from the Frontline to be informed about what’s really going on in the economy. Join hundreds of thousands of readers, and get it free in your inbox every week.
John Mauldin Archive |
© 2005-2022 http://www.MarketOracle.co.uk - The Market Oracle is a FREE Daily Financial Markets Analysis & Forecasting online publication.