


A Stealth Stocks Double Dip or Bear Market Has Started
Stock-Markets / Stock Markets 2020 Jun 24, 2020 - 04:24 PM GMTBy: Chris_Vermeulen

The stock has gone through many cycles since the 2000 tech bubble. The tech bubble was the last significant time the stock market’s popularity among individuals piqued their interest in such a huge way similar to what we see now in the markets.
Market legend Jeremy Grantham recently talked on CNBC about the price action in the markets is the “Real McCoy” of bubbles. We will get back to his insight later in this article, but let’s get into some technical analysis that helps us see when and where the market bubble could burst. When it does, it’s going to seriously hurt all the newly unemployed and sports betting traders who don’t know better yet how the markets move.
The stock market and how it moves is always evolving. Since 2008 when the FED stepped into the bailout America, which manipulated the financial system, the markets have been riddled with new policies by presidents and the Fed.
Instead of letting the markets naturally correct and revalue stock prices with each economic cycle (which is more or less what happened in the past), now, leaders and central bankers don’t want to let the music stop. Now they are pushing money into the economy and making the rules/policies/taxes better for each business.
Unfortunately, we know how all this fiscal stimulus and manipulation will ultimately end. Changing rules/policies, pumping money into the economy, and giving out free money, may help short term, but this only worsens everyone down the road.
Currently, traders and investors think they have the fed acting like their parents to fall back on if things get tough and that there are no financial threats to a falling stock market. Traders are paying a premium for stocks and buying ever pause of dip. While all those traders may be feeling great with position and gains, they can and will likely all be wiped out soon enough if position sizing and risk management are not in place for each position held.
Don’t get me wrong, I am not a doomsday kind of person, but this is “Crazy Stuff” as Jeremy said in his recent interview.
Ok, now with that rant behind us, let’s move on to three simple charts that paint a clear picture because last week’s closing price action is potentially the beginning of something ugly.
I know my team, and I have been talking about a market top and lower prices for a long time as we are trying to warn as many traders and investors as we possibly can. Unfortunately, the FOMO (fear of missing out) on this rally has taken over peoples emotions and forcing them to buy buy buy and think its smooth sailing from here, which we believe is not the case. Going against the herd during extreme sentiment times like this is tough to do.
Take a look at these charts for a simple view of the market internals weakening and how it has proved to play out in the past.
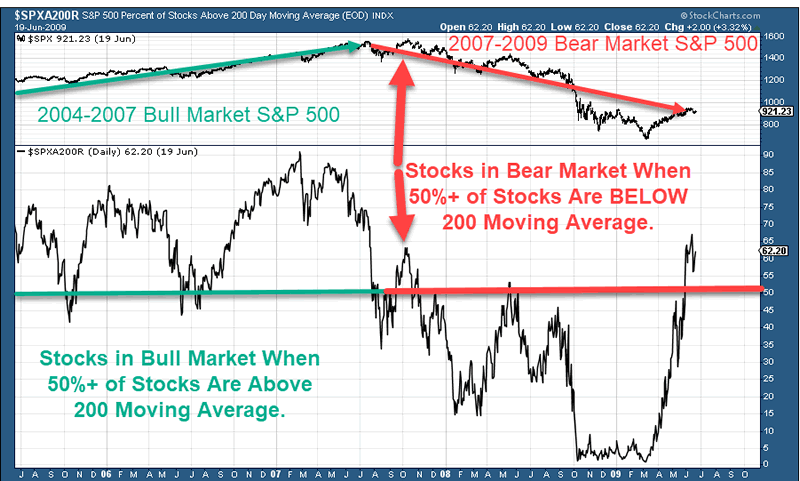
S&P 500 VS Stocks Trading Above 200-Day MA 2004-2009 Bull & Bear Market
This chart is fairly clear in showing that when 50% or more of stocks are trading above the 200-day moving average, we are in a bull market. It is not a short term indicator, it does lag, but the setup with the red arrows shows the strong stock market rally in the top, and the breakdown below 50% and the rebound of stocks trading over the 200 moving average. This is what happened during the last bull and bear market and just like what we are experiencing now.
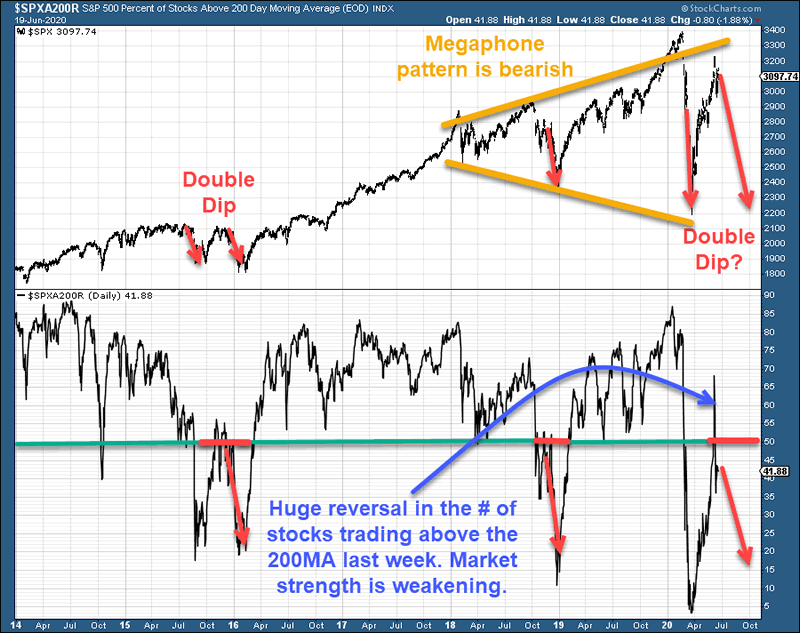
S&P 500 VS Stocks Trading Above 200-Day MA 2014 – 2020 Bull & Bear Market
This chart shows a few interesting things. First, the number of stocks trading over the 200-day moving average is below 50%. Last week this value had a massive reversal indicating the majority of stocks have been experiencing momentum moves to the upside and are now starting to be sold.
Momentum stocks are when stocks move so quickly to the upside that everyone has FOMO and just chasing prices higher. Once they begin to roll over, everyone panics and dumps the shares, and the share value falls fast and hard. This is a bearish sign because once the momentum stalls, we know what goes straight up, generally comes straight back down for at least half of the recent rally.
The other pattern that is of concern is the megaphone pattern. This indicates price instability and adds more risk to investors’ long stocks and not planning to dump them when things turn south.
Since 2015 the market has had all kinds of landmines and manipulation form fed, new tax policies, etc. In my opinion, and many others I have talked with 2015/2016, the market was ready for a normal correction cycle (bear market), but the new policies put in place supercharged the economy for another mega wave higher, which brings us to today. As I mentioned before, when you start gaming the system and changing the rules, things become uncertain and unstable long term, which eventually leads to failure. Megaphone patterns show precisely the unstable price and health of the market.
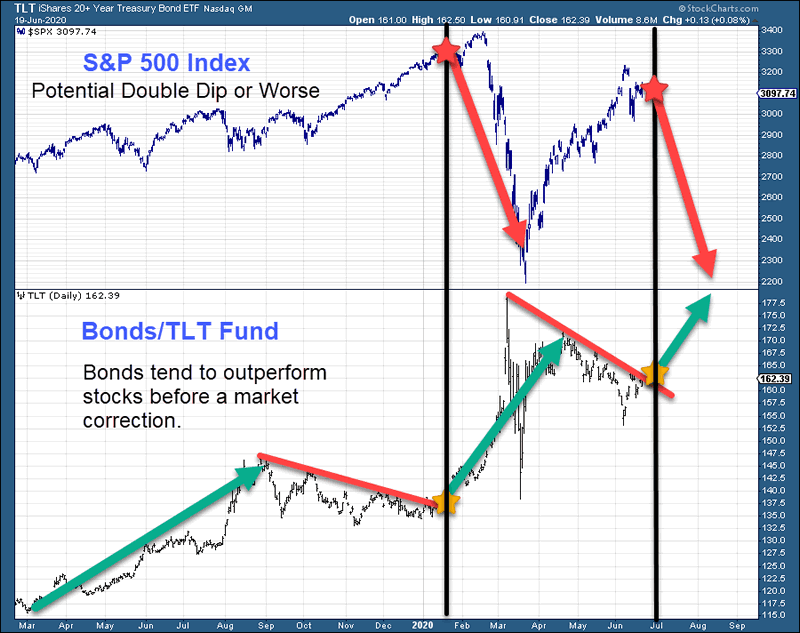
Bonds Point To Near Term Market Weakness
Bonds have been holding up exceptionally well during this fed induced rally. Bonds tend to lead the stock market and start to rally or at least outperform stocks before the stock market corrects in any significant way.
For example, in January this year, we traded GDXJ and TLT as they were leading the way and pointing to much higher prices vs. the stock market. GDXJ we locked in 10% and exited the position it at the high tick the day when gold miners topped and fell 57% over the next few weeks. That price level, which we exited was a significant resistance zone and was our target price to exit.
TLT had broken out of a huge bull flag and was starting to outperform stocks. We purchased TLT and ended up closing that out for over 20% as the stock market crashed.
Both of these assets not only warned us that the stock market was becoming fragile but provided great trading opportunities.
This shows you the power of using inter-market analysis, technical analysis, and predefined trading rules. By using these techniques, you don’t get sucked into the emotional side of trading, which leads to falling in love with winners and not selling them until they turn into losers you that you can’t handle the size of the loss anymore.
If you have not yet watched this video where I compile our recent major calls of the Feb crash months before it happened, the 30% rally prediction, and more on what I am talking about in this article, be sure to watch this video.
If you have time for another video Jeremy Grantham Insight Is So Spot-On and Eye Opening!
Concluding thoughts:
In short, I hope you glean something useful from this article and that I don’t come across as a doomsday kind of guy. If this is the start of a double-dip, it’s going to be huge, and if it’s the start of a bear market, it is going to be life-changing.
If you are new to trading, technical analysis, or are a long term passive investor worried about what to do, you can follow my lead. I share both my investing signals and more active swing trade signals using simple ETFs at www.TheTechnicalTraders.com
Chris Vermeulen
www.TheTechnicalTraders.com
Chris Vermeulen has been involved in the markets since 1997 and is the founder of Technical Traders Ltd. He is an internationally recognized technical analyst, trader, and is the author of the book: 7 Steps to Win With Logic
Through years of research, trading and helping individual traders around the world. He learned that many traders have great trading ideas, but they lack one thing, they struggle to execute trades in a systematic way for consistent results. Chris helps educate traders with a three-hour video course that can change your trading results for the better.
His mission is to help his clients boost their trading performance while reducing market exposure and portfolio volatility.
He is a regular speaker on HoweStreet.com, and the FinancialSurvivorNetwork radio shows. Chris was also featured on the cover of AmalgaTrader Magazine, and contributes articles to several leading financial hubs like MarketOracle.co.uk
Disclaimer: Nothing in this report should be construed as a solicitation to buy or sell any securities mentioned. Technical Traders Ltd., its owners and the author of this report are not registered broker-dealers or financial advisors. Before investing in any securities, you should consult with your financial advisor and a registered broker-dealer. Never make an investment based solely on what you read in an online or printed report, including this report, especially if the investment involves a small, thinly-traded company that isn’t well known. Technical Traders Ltd. and the author of this report has been paid by Cardiff Energy Corp. In addition, the author owns shares of Cardiff Energy Corp. and would also benefit from volume and price appreciation of its stock. The information provided here within should not be construed as a financial analysis but rather as an advertisement. The author’s views and opinions regarding the companies featured in reports are his own views and are based on information that he has researched independently and has received, which the author assumes to be reliable. Technical Traders Ltd. and the author of this report do not guarantee the accuracy, completeness, or usefulness of any content of this report, nor its fitness for any particular purpose. Lastly, the author does not guarantee that any of the companies mentioned in the reports will perform as expected, and any comparisons made to other companies may not be valid or come into effect.
Chris Vermeulen Archive |
© 2005-2022 http://www.MarketOracle.co.uk - The Market Oracle is a FREE Daily Financial Markets Analysis & Forecasting online publication.