


Stock Market Massive Dual Head-and-Shoulders Setup
Stock-Markets / Stock Markets 2020 Aug 23, 2020 - 07:39 PM GMTBy: Chris_Vermeulen

- Dual Head-and-Shoulders patterns warn of a potentially big downside move and new highs may be a trap for bulls
- Valuation levels suggest the broader US stock market is lagging
- Precious metals continue to warn of risks
- The market “melt-up” may be nearing an end
My research team is issuing a Special Alert Warning after the NASDAQ and SPY reached new all-time highs. Our research team identified a massive Head-and-Shoulders pattern (highlighted in BLUE) that originated in 2014, set up a “head” in 2018, and is now forming a “right shoulder” spanning 2019 and 2020. Additionally, a minor Head-and-Shoulders pattern is setting up on the right side of the chart below (highlighted in MAGENTA) that peaks in early February 2020 – just before the COVID-19 price collapse. Will this dual Head-and-Shoulders pattern prompt a massive downside price move over the next few weeks and months, or will the US stock market continue to rally higher – breaking the resistance level the shorter-term “head” (near $174) and keep going?
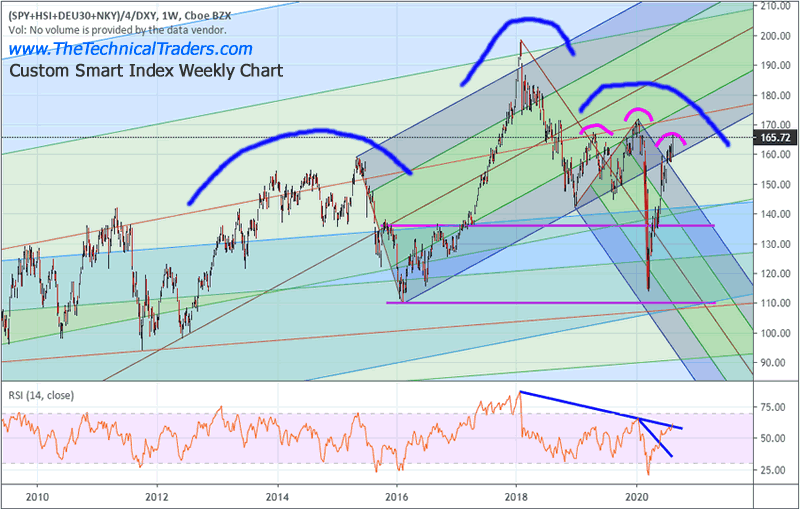
Even though the NASDAQ and the SPY reached new all-time highs today, we’ve been warning that the US stock market is currently riding a wave of speculation and rising multiples that does not support the organic growth models our researchers use to track price activity and trends. Our Custom Smart Cash Index highlighted a peak in the US and global markets that took place in February 2018. This peak price level represents a true organic growth peak for the global stock market. After that peak, price levels on our Custom Smart Cash Index began to decline even though the global central banks and US Fed started printing capital to support trade issues, failing global economies, and the COVID-19 virus event. My researchers believe the true peak in organic global economic opportunity and growth peaked in February 2018 and the current peak price levels are driven by “pure speculation”.
In support of this Special Warning Alert, we want to be very clear about the potential outcome of these Dual Head-and-Shoulders patterns. Either the markets are going to react to these massive setups and potentially begin to move downward after the right shoulder completes and price initiates a breakdown trigger… OR… price will attempt to continue to rally in an attempt to break the minor and major right shoulder peak levels (head levels). This is one of those technical setups that allow skilled technical traders to take advantage of any eventual outcome (up or down).
Our researchers believe there is a much higher likelihood of downside price move initiating from these Dual Head-and-Shoulders triggers – possibly as a result of concerns related to the US Presidential election event or as a result of the US election outcome (or something else). Even though it appears the US economy is gaining some traction in the recovery process, we are seeing only 4% to 5% of the S&P500 listed companies really experiencing strong revenue growth whereas the remaining 95% are weaker or barely holding on to revenue levels.
Before you continue, be sure to opt-in to our free-market trend signalsnow so you don’t miss our next special report!
The US Fed and Congress have maneuvered to attempt to provide necessary assistance for small businesses and most Americans, yet the longer the shutdowns continue, the more damage is inflicted on the US economy and consumers. All of this taking place months before a highly contested US Presidential Election could be a recipe for a disaster in the near future. If the US Government continues to act paralyzed before the November 2020 election event, it will hurt US consumers and small businesses the most.
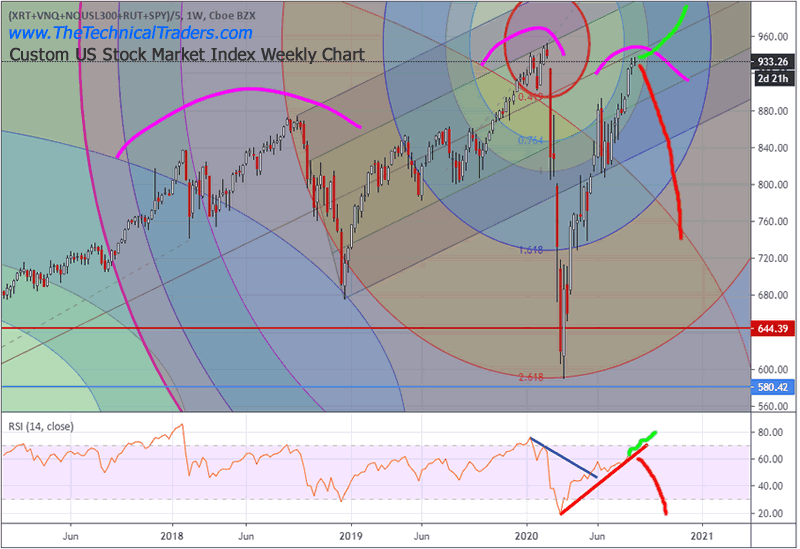
The Weekly Custom US Stock Market Index chart, above, highlights another Head-and-Shoulders pattern that appears to be setting up as a massive warning. Again, prices could continue to rally higher, breaking above the $960 (head level) and continue to rally. Yet, right now, our other Custom indexes are all setting up in a manner that suggests we could see a downside price move and increased volatility over the next 60 to 90+ days. We’ve drawn some examples of what may happen (bullish or bearish) as this pattern concludes.
Lastly, our Custom Volatility Index Weekly chart, below, suggests that even though he NASDAQ and S&P500 rallied to near all-time highs today, the valuation levels on the Custom Volatility Index chart are still 40% to 50% below previous market peak levels (near 20~22). Because of this, we believe the risk of an extremely volatile price move (up or down) is very high. The VIX is currently trading near 21.57 and has flattened out above the VIX Spike GAP on February 24, 2020. It is very likely that the VIX may take another 12 to 18+ months to settle back down below 12 to 14 again and this suggests increased volatility still exists in the global markets.
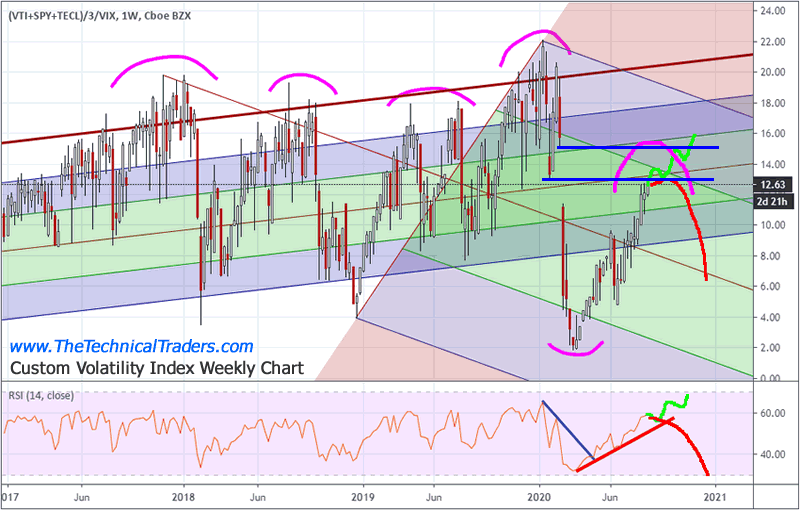
There are two key levels our researchers are watching on our Custom Volatility Index, the 13.00 level, and the 15.05 level (highlighted in BLUE). We believe both of these levels will be critical for price to move higher (or initiate a breakdown move) as the “melt-up” rally attempts to continue. Skilled technical traders need to be very aware of the risks that are present in the current markets at this time and heed the Head-and-Shoulders patterns until we see a very clear outcome (either bullish or bearish).
Pay attention to the Head-and-Shoulders shoulders pattern setting up on the Custom Volatility Index Weekly chart as well. The warnings are everywhere at this time. Better to be aware and cautious than caught off guard by a volatile price event.
We’ve clearly laid out the possibility that the “melt-up” could continue and the breakdown price event we are warning about may not actually happen. Yet we believe there is a fairly high likelihood that unknowns and concerns related to the US and global economy, the US Presidential Election event and the outcome of that event as well as how consumers and small- and medium-sized businesses will fair over the next 6+months could very well define the outcome of the speculative “melt-up” process. Remember, what happens with the US Presidential Elections is really a global event in terms of the economy and future expectations.
As a technical analyst and trader since 1997, I have been through a few bull/bear market cycles in stocks and commodities. I believe I have a good pulse on the market and timing key turning points for investing and short-term swing traders. 2020 is going to be an incredible year for skilled traders. Don’t miss all the incredible moves and trade setups.
Please take precautions over the next few weeks and months. Watch metals and the US Dollar for signs that the markets are weakening. The next 60+ days are going to get more and more chaotic leading up to the US Presidential Election event. Anything could happen and we believe the new cycles, much like 2016, could become a real issue going forward.
If you found this informative, then sign up now to get a pre-market video every day before the opening bell that walks you through the charts and my proprietary technical analysis of all of the major assets classes. You will also receive my easy-to-follow ETF swing trades that always include an entry price, a stop, two exit targets, as well as a recommended position sizing. Visit my Active ETF Trading Newsletter to learn more.
While many of you have trading accounts, our most important accounts are long-term buy-and-hold investment accounts. Our signals can help you preserve and even grow your long term capital. If you have any type of long-term investment or retirement account and are looking for signals as to when to own equities, bonds, or cash, be sure to become a member of my Long-Term Investing Signals, which includes a weekly market update and trade alerts.
Chris Vermeulen
www.TheTechnicalTraders.com
Chris Vermeulen has been involved in the markets since 1997 and is the founder of Technical Traders Ltd. He is an internationally recognized technical analyst, trader, and is the author of the book: 7 Steps to Win With Logic
Through years of research, trading and helping individual traders around the world. He learned that many traders have great trading ideas, but they lack one thing, they struggle to execute trades in a systematic way for consistent results. Chris helps educate traders with a three-hour video course that can change your trading results for the better.
His mission is to help his clients boost their trading performance while reducing market exposure and portfolio volatility.
He is a regular speaker on HoweStreet.com, and the FinancialSurvivorNetwork radio shows. Chris was also featured on the cover of AmalgaTrader Magazine, and contributes articles to several leading financial hubs like MarketOracle.co.uk
Disclaimer: Nothing in this report should be construed as a solicitation to buy or sell any securities mentioned. Technical Traders Ltd., its owners and the author of this report are not registered broker-dealers or financial advisors. Before investing in any securities, you should consult with your financial advisor and a registered broker-dealer. Never make an investment based solely on what you read in an online or printed report, including this report, especially if the investment involves a small, thinly-traded company that isn’t well known. Technical Traders Ltd. and the author of this report has been paid by Cardiff Energy Corp. In addition, the author owns shares of Cardiff Energy Corp. and would also benefit from volume and price appreciation of its stock. The information provided here within should not be construed as a financial analysis but rather as an advertisement. The author’s views and opinions regarding the companies featured in reports are his own views and are based on information that he has researched independently and has received, which the author assumes to be reliable. Technical Traders Ltd. and the author of this report do not guarantee the accuracy, completeness, or usefulness of any content of this report, nor its fitness for any particular purpose. Lastly, the author does not guarantee that any of the companies mentioned in the reports will perform as expected, and any comparisons made to other companies may not be valid or come into effect.
Chris Vermeulen Archive |
© 2005-2022 http://www.MarketOracle.co.uk - The Market Oracle is a FREE Daily Financial Markets Analysis & Forecasting online publication.