


Honest Money Financial Markets Wrap - Stocks, Commodities and Gold
Stock-Markets / Financial Markets May 21, 2007 - 02:59 PM GMTBy: Douglas_V_Gnazzo

Economy
The Conference Board reported that the U.S. leading index decreased 0.5%, the coincident index increased 0.2%, and the lagging index increased 0.2% last month (April). In April, the NAHB's (national association of home builders) index registered 33; for May, it was 30. The trend is clearly headed down. This is not good.
The Philly Fed Index came in at +4.2 compared with the previous +0.2. For April, the Reuters/University of Michigan's preliminary index of consumer sentiment increased to 88.7 from 87.1. This is good.
Home Depot Inc. reported that net income dropped 30%. Sales rose 0.6%, the smallest gain in four years. Not good.
The US Department of Commerce reported that housing starts rose 2.5% in April to a seasonally-adjusted annual rate of 1.53 million units.
However, housing permits fell 8.9% in April, which is the largest single monthly decline in 17 years. First part good - second part not good.
Median home prices fell 1.8% to a two-year low in the first quarter as prices fell in almost half of U.S. cities, the National Association of Realtors said. Depends on if you're buying or selling.
U.S. foreclosure filings jumped 62% in April from a year earlier. NG.
For the month of April, The Commerce Dept. reported that Industrial Production rose 0.7%. Good.
The Bureau of Labor Statistics reported that the Consumer Price Index increased 0.6% in April, before seasonal adjustment.
During the first four months of 2007, the index has risen at a 4.8% seasonally adjusted annual rate. I don't believe it.
The New York Fed's measure of new orders rose to 8.0 from 3.9, and a gauge of shipments rose to 14.1 from 8.7. Good.
Needless to say - the signals are mixed. Some look good - some look terrible. Kinda like blind dates - remember those?
China's central bank said Friday that it will raise interest rates, increase banks' reserve requirements, and let the Yuan trade in a wider daily range against the U.S. dollar, stepping up efforts to rein in its overheating economy.
China said it will widen the trading band of the Yuan against the dollar to 0.5% above and below its central parity rate from 0.3%, effective Monday. The wider ban is just hot air, means nothing - not that it has to. China does not have to run their monetary policy to suit us.
The central bank also raised benchmark deposit and lending rates. The one-year Yuan lending rate will rise Saturday by 0.18% to 6.57% from 6.39% and the one-year Yuan deposit rate will increase by 0.27% to 3.06% from 2.79%. Accompanying the interest-rate rise is a half of a percentage point increase in banks' reserve requirement ratio, effective June 5.

 Gold & Silver
Gold was down -10.30 for the week, closing at $662.00 (-1.53%).
Its intra-week high was $676.40 and its intra-week low was $654.10.
It was gold's lowest weekly close in 5 weeks.
The pog did not end the week on its lowest daily close - that took place on Thursday's close of $657.20.
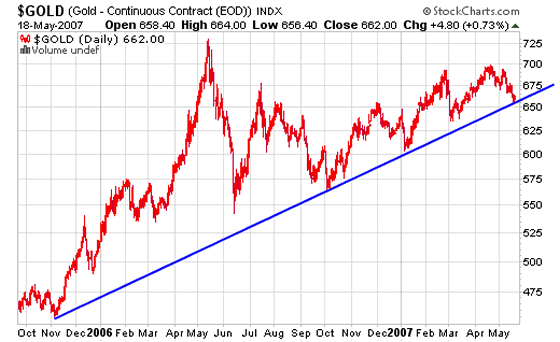
The first chart up is the daily chart of gold going back a little more than one year. Gold is sitting on its bottom trend line, which needs to hold as support.
Next up is the same chart of gold; however, this chart depicts or highlights a different view of the price action.
The price of gold is sitting right on its bottom trend line, and could be about to break down below it. We will know this coming week.
However, gold is in a bull market until such time that it isn't, and until then we will give it the benefit of the doubt, unless the above stated possible breakdown occurs, and is confirmed by a two day or weekly close with follow through action to the downside.
Higher lows have continually been maintained throughout the gold bull market, and as long as this holds true - higher highs will follow.
The chart depicts a symmetrical triangle formation that gold has been in for about a year now. The height of the triangle is becoming less and less, in turn compressing the price tighter and tighter.
Usually such formations resolve themselves by the compressed or coiled price bursting through above and out of its triangular pattern.
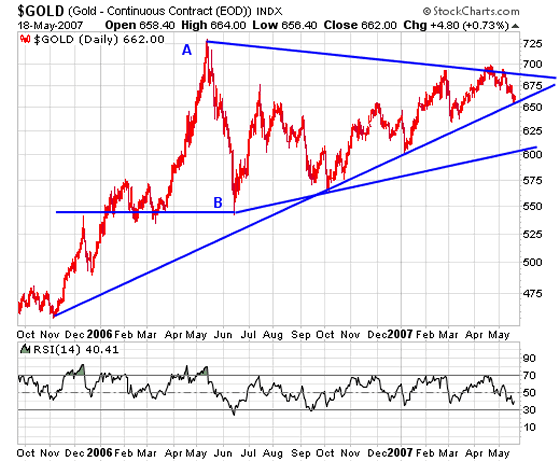
Look at the height of the triangle back in May of 2006 when it was at its highest level. The price of gold had risen from about $550 (B) up to about $725.00 (A) for ease of figuring. That was a rise of $175.00 or 32%.
When symmetrical triangles resolve themselves to the upside the general rule of thumb is that the move up will be approximately equal to the height (percentage) of the triangle at its apex.
This implies that if gold breaks up and out of its formation it could move up by approximately 32%. Presently gold is at $659.30.
Thirty-two percent of $659.30 equates to a move up of $211, or to a price of $870.30 (659.30 + 211 = 870.30).
We should know very soon which way gold is going to break. It could still break down - that is how close a call it is.
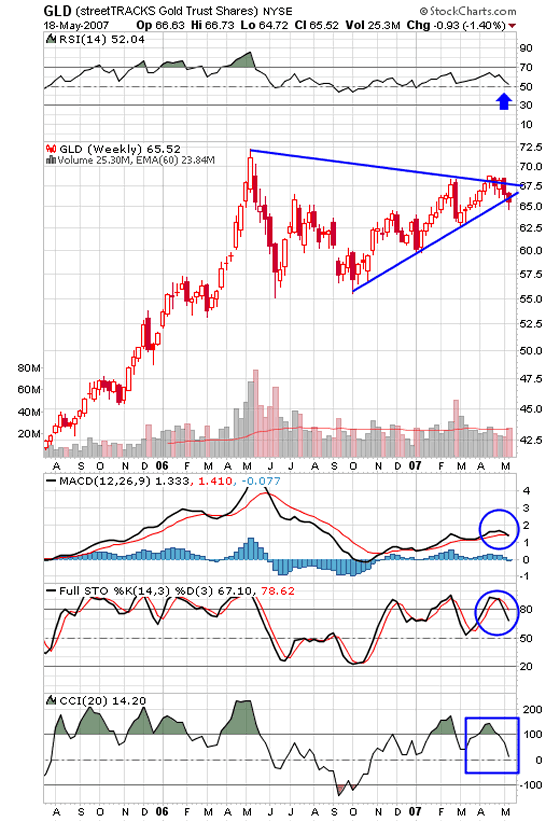
Signals at this time are mixed. Some indicators point up, while others point down. Below is the weekly chart for GLD, the gold exchange traded fund (etf).
GLD is presently sitting on its bottom trend line at 66.52. A two day break below this level would indicate further weakness that would confirm more downside action is coming.
There are, however, several areas of previous higher lows that offer support: 62.50, 60.00, & 57.50. RSI is still holding above 50.
MACD is close to making a negative cross over, and at the same time it could also turn up. If it is going to turn up, it will need to do so very soon.
Stochastic readings were above 80 in overbought territory and are headed down. They have plenty of room to fall before being oversold.
At the same time notice how previously the STO has dipped to the 50 level and bounced back up, and before that to only the 70 level where it is now.
The CCI Index shows that gld was overbought above the 100 zone and has fallen down and is now approaching zero.
What was just said above for the STO holds true here as well. It could go either way.
If gold is to keep from breaking down, however, it has to start moving up within days.
If it doesn't, this would not indicate that the end of the gold bull was occurring, simply that a longer and deeper correction was unfolding.
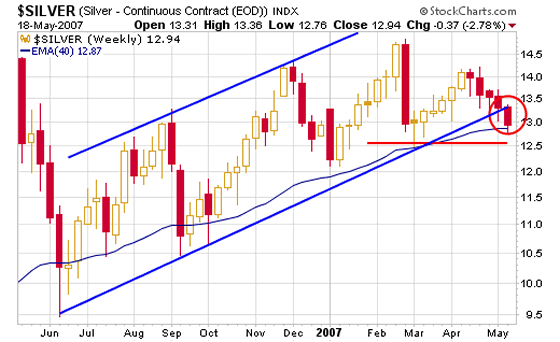
Silver
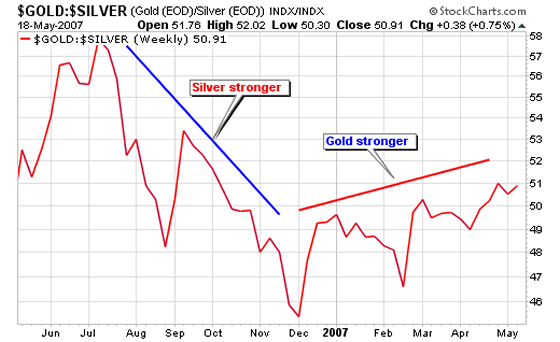
Silver has been weaker then gold recently. Several months ago it was silver that was the stronger performer, but now that has changed.
Next up is a weekly chart of silver. It shows silver breaking below its bottom trend line, and where the next support level resides.
Hui Index
The Hui fell -9.25 points this week to close at 328.59 (-2.74%). It was the lowest weekly close for the Hui in 7 weeks. The daily closing low for the week was on Thursday at 322.59. The intraday low was 319.56.
The daily closing high for the week was 331 on Monday. The intraday high was 339.09, also on Monday.
The index did not close on its low for the week. It gained from both Wed. and Thursday's closing prices.
The first chart is a weekly chart of the Hui going back for about 2 years. It is a simple chart with hardly any indicators, or trend lines, etc. All we have done is to point out in blue arrows the series of higher lows.
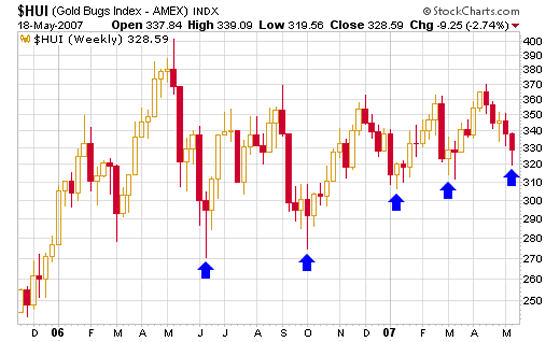
Higher lows are very important to keep a bull market going. If higher lows stay intact - higher highs will follow there from.
Next up is a daily chart of the Hui going back about a year. Once again the series of higher lows are indicated.
Notice the positive divergence between the slope of the trend line connecting the higher lows, and the slope of the trend line connecting the RSI lows above.
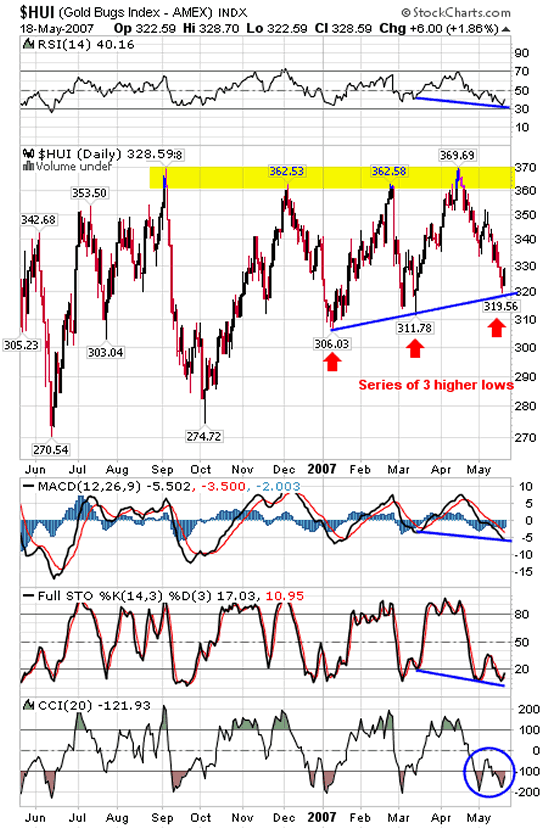
The yellow highlighted area between 360-370 shows the overhead resistance zone that needs to be broken through.
Both MACD and STO also show positive divergence. STO is oversold, as is the CCI indicator below.
The positive divergences now need to be resolved by positive price action - up - and soon.
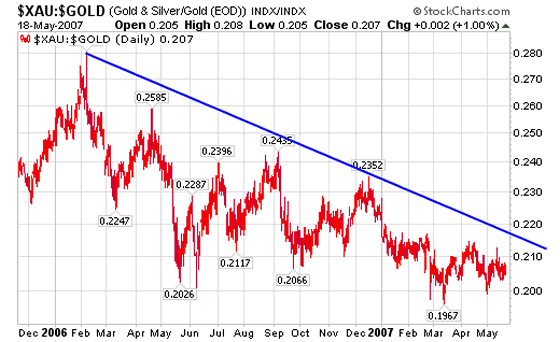
Next up is a chart comparing the Hui to Gold. The chart covers about a year's worth of price action.
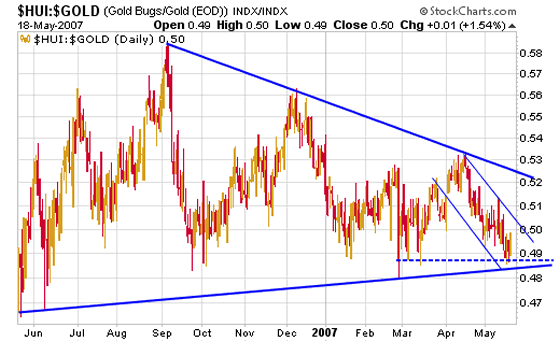
Since Sept. of 2006 the gold stocks have predominantly been under performing physical gold.
From Oct to Dec they out performed and from Jan of 2007 to April. The overall trend, however, has been down.
From April until May the trend has continued down. Just recently it has started to slowly turn up, as the next chart shows.
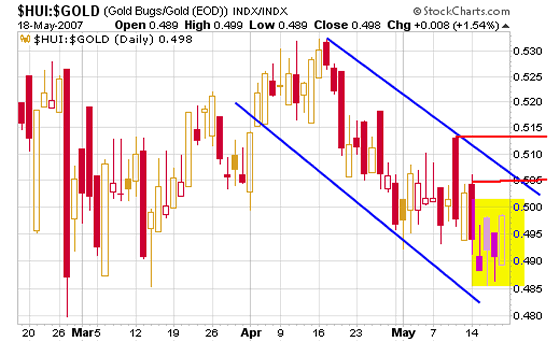
Next is a short time frame chart of the Hui/Gold Ratio. The yellow highlighted area shows the recent "rebound" from the ratio's lows.
The red lines show significant "horizontal" resistance levels.
A break above its downward channel's upper trend line would be very positive, especially if it holds and thus signals a possible trend change.
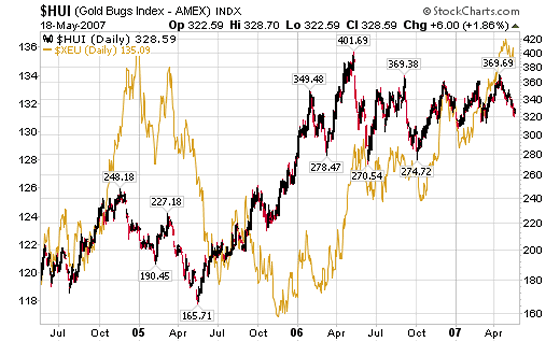
Next up is the Hui with the Euro overlaid on it. The correlation is fairly constant.
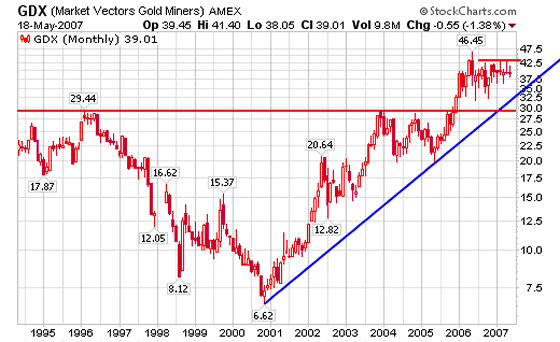
Below is a monthly chart of the GDX Gold Miners Index. The long term trend is clearly up, and moves from the bottom left corner to the top right hand corner - a bullish signature.
Resistance is at the upper red horizontal line near 42.50. Significant support resides at the lower horizontal red line just below 30.00.
Xau Index
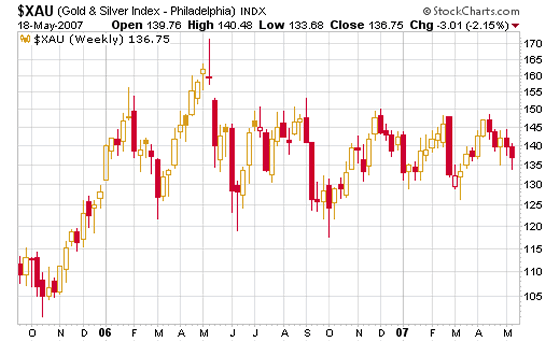
The Xau closed down -3.01 to 136.75 (-2.15%). It was the lowest weekly close for the past 8 weeks.
The weekly daily closing low was 134.97 on Thursday. The intraday low was 133.68 on Thursday as well.
The weekly daily closing high was 137.49 on Tuesday. The intraday high was 140.48 on Monday. The index gained from Wed. through Friday's close.
The first chart below is a weekly chart of the Xau going back 20 months. It shows a series of higher lows since Oct. of 2006.
Essentially the Xau has been trading in a zone between 130 - 150 for the past half year.
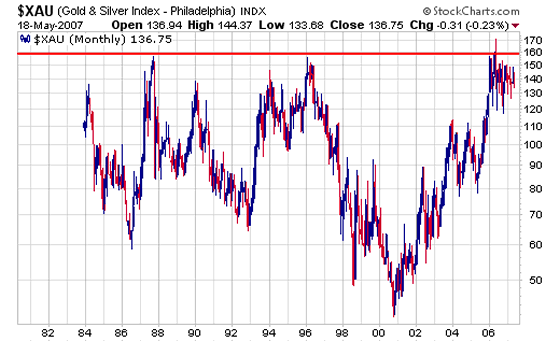
Next is a monthly chart of the Xau going back to 1984. Overhead resistance is clearly defined by the red horizontal line connecting the tops all right around 160.
This is key resistance to be broken. It would signal the next leg up of the gold bull.
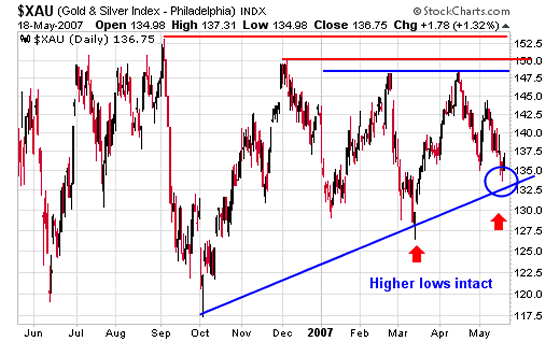
Next we have another daily chart of the Xau that shows a different view. The chart goes back about a year in time.
The bottom trend line shows the higher lows intact. The blue circle shows the present level of the Xau (136.75), which is about 4.25 points above its lower trend line (132.50).
The blue horizontal line indicates the first major resistance line; the next red horizontal line at 150 shows the second line of resistance; and the last red line indicates the high to be taken out.
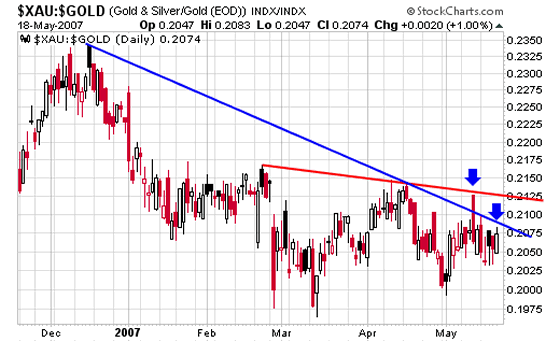
Below is the chart of the Xau/Gold Ratio going back about 18 months. It clearly shows that the trend has been steadily down, meaning the gold stocks have been under performing physical gold.
The blue upper trend line represents significant overhead resistance that if broken through and sustained would indicate the next leg up of the gold bull was underway.
The second chart below also shows the Xau/Gold Ratio, but going back only 6 months in time. Once again, the blue upper trend line indicates overhead resistance that needs to be taken out.
The red line represents even more significant resistance that would be very bullish if taken out.
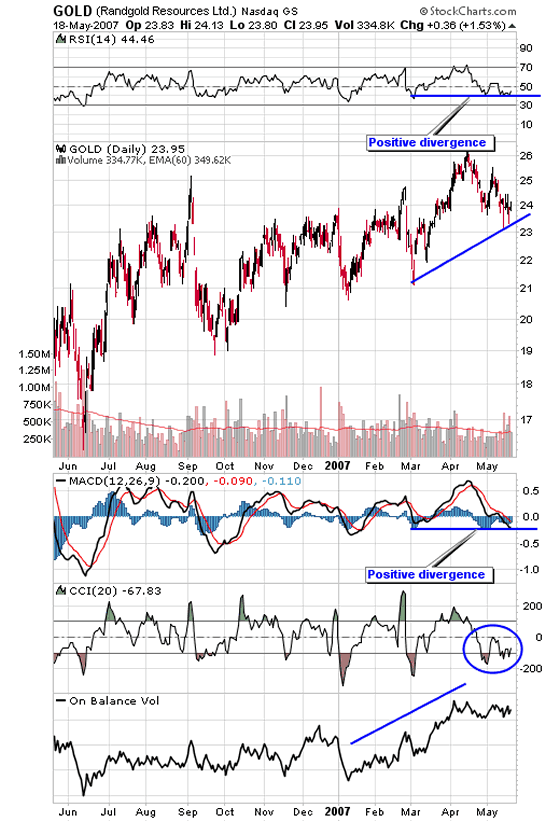
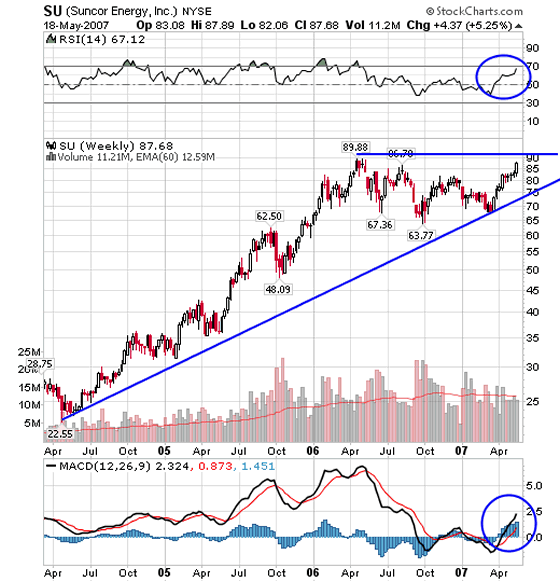
Stocks Picks
Below are the charts of this week's stock picks.
We own Randgold and will be accumulating more on pullbacks that hold support.
Suncor we have owned and sold and are looking for a significant pullback for a possible re-entry point.
We were too early in last time, and too early out. We made a profit but our timing stunk.
Summary
Stocks in the U.S. and most other foreign markets are setting new highs almost weekly.
Conspicuously absent from the party are the stock markets of the oil rich Mideast Gulf States. Joining them is our own Nasdaq market, which is about 50% off its highs.
The rise in the stock markets, as well as most other asset classes, is the result of profligate monetary and credit creation - predominantly the latter.
The boyz on the street come up with new credit instruments almost monthly. As they say - there's more than one way to skin a cat.
This doesn't mean that profits are not being made, but profits that one keeps, and profits that beat inflation, are not as easily had as the boyz would lead you to believe. The chart of the Dow Industrials compared to Gold clearly bears this out. Gold has been the winner hands down.
The bond market may be the most important of all. It is the largest market except for the forex market, but that includes all world currencies so it is not comparing apples to apples.
Not only is the bond market our largest market, it is the most important, as in paper fiat land - money, credit, and debt are one and the same. In the New World Order black is white and white is black: money is debt and debt is money.
Our entire - the world's entire, monetary and financial system is based on debt - constant and ever-increasing debt. If the long end of the yield curve keeps backing up, the mortgage market and the real estate market will be in worse trouble then they already are.
The Fed knows this and will fight tooth and nail to prevent it. But they cannot defend both the bond market and the U.S. Dollar. One or the other will give, and when it does it will take down the others with it.
It will most likely not happen immediately, or all at once, but happen it will. After every boom follows a bust - the question is when and from what level. It's always about timing.
 Oil and natural gas have had nice rallies. We caught part of the oil rally but missed out on natural gas, although we had talked and talked about it coming so much, we talked ourselves right out of it.
We will be looking to re-enter both markets on significant pullbacks that hold support, focusing on Suncor and Natural Gas later this summer, especially the latter. Seasonally, NG usually puts in a late summer low before the start of the winter season and a move up. Hurricane season can change this, however.
Gold and silver have been in a prolonged correction for over a year now. We had warned of this possibility when gold first crossed 500 and the talk was of the second stage of the gold bull.
We mentioned that when an intermediate term correction occurred, and 500 held as support - that's when the second stage would begin.
Even though we expected this to happen, and were prepared, the length and many false signals of this correction have kept us hopping.
Gold, silver, and the precious metal stocks all sit on the edge and could go either way. Soon they should show their hand either way - up or down.
We still have a slight bias that the move will be up, however, we do not think that even if it occurs that it will be the start of the next leg up of the gold bull market. It could be, but first it needs to occur, and second the landscape will then need to be reassessed.
If the pm sector does move up from here, the most likely scenario would be a move to test the old highs. The test may fall short or could go a bit beyond, however, we think that it will then correct back down one last time.
 Here is what we consider the most probable scenarios to be.
There are many more then these, and various subsets as well.
These are meant to be rough guideposts - they are NOT written in stone or blood.
Scenario #1 :
-
A move up that tests the old highs.
-
Then a correction back down.
-
Followed by the next leg up of the bull.
Scenario #2 :
-
A move down now to test the lows.
-
Then a move up to test the highs.
-
Then one last correction down before the next leg up.
Subset : Upon the test of the highs the market keeps going up into the next leg up.
Scenario #3 :
-
A move up that tests the old highs.
-
The move makes new highs.
-
The move continues, starting the next leg up.
Scenario #4 :
A move down from here that continues down, and changes the bull to a bear.

In closing I want to mention the upcoming Presidential election next year. Check out the Republican candidate Congressman Ron Paul from Texas.
I have written an article on the first Republican Debate that not only covers the debate, but has several links to videos you can watch of Ron Paul being interviewed and or speaking.
If you like the freedoms and liberties that our Constitution espouses and mandates, then you will like the ideals that Dr. Ron Paul advocates: strict adherence to the Constitution, including the Honest Money system of Gold & Silver Coin as mandated by the Constitution and the Original Monetary Act of 1779.
It is time for all true patriots to stand up and be counted. Use the power of your sovereign vote to take control of who represents YOU in the halls of government ordained by We The People. The Republican Presidential Debate (clink link for article).
Invitation
Stop by our website and check out the complete market wrap, which covers most major markets. There is also a lot of information on gold and silver, not only from an investment point of view, but also from its position as being the mandated monetary system of our Constitution - Silver and Gold Coins as in Honest Weights and Measures.
There is also a live bulletin board where you can discuss the markets with people from around the world and many other resources too numerous to list. Drop by and check it out. Good luck. Good trading. Good health. And that's a wrap.
Douglas V. Gnazzo
Honest Money Gold & Silver Report
Douglas V. Gnazzo is the retired CEO of New England Renovation LLC, a historical restoration contractor that specialized in the restoration of older buildings and vintage historic landmarks. Mr. Gnazzo writes for numerous websites, and his work appears both here and abroad. Just recently, he was honored by being chosen as a Foundation Scholar for the Foundation of Monetary Education (FAME).
Disclaimer: The contents of this article represent the opinions of Douglas V. Gnazzo. Nothing contained herein is intended as investment advice or recommendations for specific investment decisions, and you should not rely on it as such. Douglas V. Gnazzo is not a registered investment advisor. Information and analysis above are derived from sources and using methods believed to be reliable, but Douglas. V. Gnazzo cannot accept responsibility for any trading losses you may incur as a result of your reliance on this analysis and will not be held liable for the consequence of reliance upon any opinion or statement contained herein or any omission. Individuals should consult with their broker and personal financial advisors before engaging in any trading activities. Do your own due diligence regarding personal investment decisions. This article may contain information that is confidential and/or protected by law. The purpose of this article is intended to be used as an educational discussion of the issues involved. Douglas V. Gnazzo is not a lawyer or a legal scholar. Information and analysis derived from the quoted sources are believed to be reliable and are offered in good faith. Only a highly trained and certified and registered legal professional should be regarded as an authority on the issues involved; and all those seeking such an authoritative opinion should do their own due diligence and seek out the advice of a legal professional. Lastly, Douglas V. Gnazzo believes that The United States of America is the greatest country on Earth, but that it can yet become greater. This article is written to help facilitate that greater becoming. God Bless America.
© 2005-2022 http://www.MarketOracle.co.uk - The Market Oracle is a FREE Daily Financial Markets Analysis & Forecasting online publication.