


Weekly Gold and Silver Technical Analysis Report - 27th May 2007 - Technically Precious with Merv
Commodities / Gold & Silver May 27, 2007 - 12:12 AM GMTBy: Merv_Burak

Gold just keeps moving one day up and another day down, but in the end, mostly down. Is there an end?
GOLD : LONG TERM
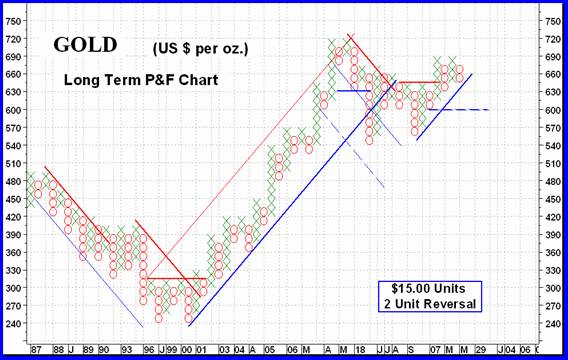
It's been some time since we had the long term P&F chart in view. Nothing much has happened since our last view but I thought that you might be forgetting what it looked like so here it is again. The last signal it gave us was a BULL signal when it broke the down trend line and then went through the $645 resistance (red lines) and hit $660. At that point it gave us a projection of $780 and then $915. With the latest activity those projections seem like pipe dreams but they are valid until otherwise nullified. To nullify, the P&F would have to reverse and per the present chart that would take a move to the $600 level, which would give us the breaking of an up trend line and a move below two previous lows (MY criteria for reversals). So, at this time the long term P&F chart still tells us we are in a long term BULL.
What about the normal indicators? Well, to start, the Friday close is sitting right on top of my long term moving average line and the line is still sloping upwards. Using the daily chart and indicators, the long term price momentum indicator is still in the positive territory but is weaker than in the past and is already below the level of the March lows. Its general trend is decidedly towards the down side so a crossing below the neutral line into the negative very soon cannot be overlooked. As for the volume indicator, it is heading lower confirming the price direction. The indicator is below its long term trigger line and the trigger has turned downward.
As the action continues to weaken I must continue to down grade my rating. For the long term I would rate the gold action as being NEUTRAL for now, heading towards the negative.
INTERMEDIATE TERM
Just a quick look at the intermediate term P&F chart (not shown) tells us it has now gone into the BEARISH camp with an initial projection to the $605 level. This is at the January low and just above the level required to turn the long term bearish. Whether it gets there or not one cannot dismiss the direction or the projection (until otherwise nullified).
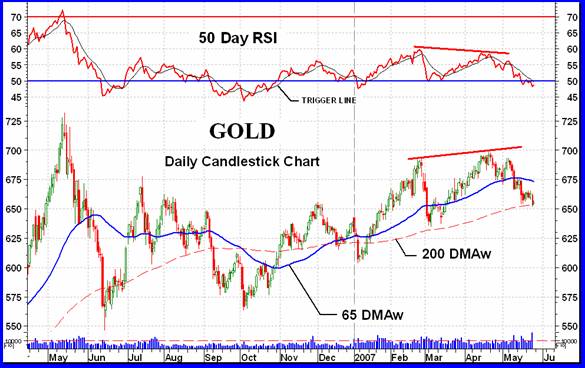
The daily chart shows that the price has broken definitely into the negative, below its intermediate term moving average line and the line slope is also following in the negative direction. The intermediate term momentum is also in its negative zone and below its negative sloping trigger line. The trigger line is shown on the chart. I often refer to this trigger line to gauge the direction of the indicator during times when the direction may be difficult to determine otherwise (such as during zig-zag movement days). The volume indicator is also in the negative and below its negative sloping trigger line.
One more important feature of the daily chart is the negative divergence of the momentum indicator versus the price action. As we can see, the new high in the price in mid-April was not confirmed by a similar new high in the momentum indicator. These divergences of the momentum indicator versus the price action are very important. They are not always perfect but when they occur a reversal of price trend should be anticipated. Buying during a negative divergence or selling during a positive divergence is just too often the wrong thing to be doing.
About the only conclusion one can come to on the intermediate term is that we are in a BEARISH phase.
SHORT TERM
For some reason most, if not all, futures traders want to know what's happening from the short (and immediate) term point of view. They use all sorts of sophisticated techniques and indicators. Here, you will only get the simple. As I suggested in my commentary a few weeks ago, you can't do much better in short term trading than following the very short term moving average (8 DMAw) slope. There were times that you would have lost a little bit of money but traders understand this. Most of the time this moving average keeps you in for the major parts of short term trends. For a little less risky indicator, the short term moving average (15 DMAw) may be substituted.
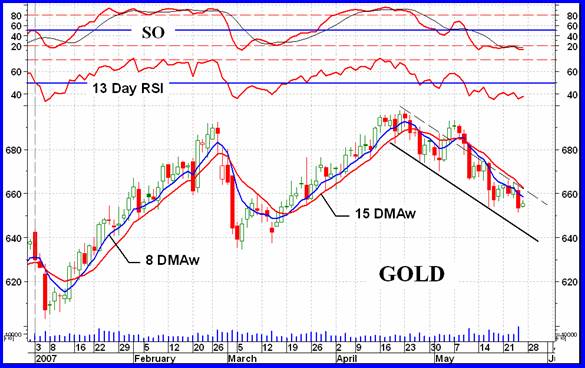
Looking at the chart the action continued during the week below the short term moving average line with the line continuing negative. Short term momentum (13 Day RSI) also remained in the negative. For now it looks like the trend will continue lower although a move to the $666 level might nullify such trend and put us back into a positive short term trend. However, go with the trend in motion.
Although I have not seen this trick anywhere in any technical books I sometimes find it easier to see trend lines when they are drawn backwards. As an example, see the trend line drawn for the past few weeks of action. During a down trend the trend line is usually drawn through rally peaks for a resistance line. Then a parallel support line is sometimes drawn at reaction lows to give us a channel that traps the daily action. However, sometimes it is not possible to draw a convenient trend line this way. What I sometimes do is draw the support lower line first, through reaction lows, and then draw a convenient upper resistance line after. Most of the action is now trapped in a convenient channel and that should contain the subsequent action until a short term reversal is at hand.
IMMEDIATE TERM
What does the flip of the coin tell us as the action in the next couple of days? Although I do not profess to be a Candlestick chart expert the action of Friday suggests a BULLISH HARAMI action. This suggests a positive day or two ahead. We'll have to see how those days turn out to guess as to the action beyond a couple of days. As possible confirmation of this is the action of the Stochastic Oscillator (SO). It has flattened out just below its oversold line and it would be very easy for it to move above the line for a rally suggestion. So, it looks like a possible day or two of upside ahead.
NORTH AMERICAN GOLD INDICES
Well here we are again with the S&P/TSX Global Gold Index. It's nothing other than the previous S&P/TSX Gold Index with a few additional stocks that are traded on the US market.
The last few weeks have been real bummers for this Index. Although all Indices have been moving lower the S&P/TSX Global Gold Index just seems to be heading down a lot faster than most. Of the four major Indices I follow in these commentaries this Index is the only one where the MACD indicator is already in the negative zone (using weekly data).
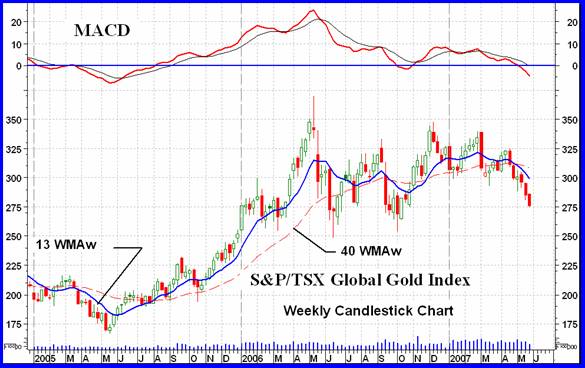
There is a very strong support ahead at about the 250 level and by all accounts that should hold, at least for a little while. Most of these major Indices still have what some might call head and shoulder patterns where the right shoulder has been quite elongated. It will be interesting to note how this will play out in the end.
MERV'S PRECIOUS METALS INDICES
Since reaching its double top several weeks ago the Merv's Composite Index of Precious Metals Indices has been acting just as I suggested at the time, heading lower and lower towards a confirmation of the double top. It still has some distance to go but is heading in that direction. The more recognizable Indices are doing their stuff towards pushing the Composite lower but the actions of the seven Merv's Indices are holding the plunge to a manageable level. What would cause this Composite Index to really plunge would be for the Merv's Indices to suddenly get a lot weaker than they presently are.
This past week the Goldman Sachs Precious Metals Index was removed and the Dow Jones Precious Metals Index was included. This Dow Jones Index with its 13 component stocks will now be part of the rolling major Indices to be reviewed. So, we now have five major Indices instead of 4. This Dow Jones Index includes companies which are engaged in the exploration or production of gold, silver and/or platinum.
On the intermediate term the Composite Index has now moved below its moving average line and the line has turned downwards. The momentum indicator is also moving lower and is in its negative zone. On the intermediate term the Composite of 23 Indices is now BEARISH.
On the long term the Index has moved below its long term moving average line but the line is still very, very slightly positive, almost horizontal. The momentum indicator is moving lower fast but is still just a hair above the neutral line for a still positive reading. Due to the negative direction but still positive location I would rate the long term as NEUTRAL, at best.
MERV'S GOLD & SILVER 160 INDEX
The average stock in the universe of 160 closed lower by 2.3% during the week. This was somewhat worse than the average loss of the major Indices. Looking over the sectors it looks like the mid-tier stocks took the brunt of the % decline. Although the mid-tier stocks may have had the largest % declines all took part in the debacle during the week. There were 111 declines on the week (69%) and 44 advances (28%). As for the summation of individual stock ratings, those moved a little lower with the long term ratings finally moving into the bearish side. The ratings stand at short term 78% BEAR, intermediate term 69% BEAR and long term 54% BEAR.
On the intermediate term the indicators have all gone negative so we are in a BEAR intermediate term market. As for the long term the Friday close was still some distance above the positive long term moving average line. The momentum is still positive but just barely so. Another week and it could go negative. For now I would rate the long term as + NEUTRAL due to the closeness of the momentum going negative.
There were no stocks making it into my speculative category of plus/minus 30% weekly moves. The stocks are just casually moving lower indicating that much more downside may still be ahead.
MERV'S QUAL-GOLD INDEX : MERV'S SPEC-GOLD INDEX :MERV'S GAMB-GOLD INDEX
Of the gold sector Indices the mid-tier or speculative Index did the worst on the week with a 2.9% decline (the Qual-Silver was even worse). The Qual-Gold Index came second at a 1.7% decline and the Gamb-Gold Index had the best showing with only a 1.0% decline. These figures were reflected in the weekly advancing/declining figures. The Spec-Gold had 80% decliners and 17% advancers. The Qual-Gold Index had 73% declining and 23% advancing while the Gamb-Gold Index had 50% declining and 43% advancing. All of the summation of individual ratings have now gone into the BEARISH side. The long term Spec-Gold Index which had a BULL rating last week is now in the BEAR camp.
Looking at the charts and indicators the Qual-Gold Index is now BEARISH for both the intermediate and long term while the Spec-Gold and Gamb-Gold Indices are BEARISH on the intermediate term but still BULLISH on the long term.
An interesting note that the major Indices and the Qual-Gold Index are well below their 2006 high mark while the Spec-Gold and the 160 Indices are just above their 2006 highs. The Gamb-Gold Index is still a considerable distance above its 2006 high. The strength is still with the gambling stocks but if the market should continue to weaken expect these stocks to take the hit.
SILVER
Although silver closed the week with no gain or loss, while gold lost 1.0%, silver still looks like it is slightly underperforming gold. This is reflected in the difference in Relative Strength (RS) ratings between the two. The price closed the week still a little above its previous low reached last March, however, both the momentum and volume indicators are already below their respective levels for a warning that the down side may still have a ways to go.
MERV'S QUAL-SILVER INDEX : MERV'S SPEC-SILVER INDEX
The Silver Indices were not good performers this past week. The Qual-Silver Index lost 3.6% on the week to be the top loser of the Indices while the Spec-Silver lost 2.6%, near the upper end of the losers. Nine of the ten component stocks in the Qual-Silver Index closed on the down side while 16 out of 25 Spec-Silver stocks closed lower. As for the summation of individual ratings, all the ratings are in the bearish camp with the Qual ratings in the 80-85% BEAR level and the Spec ratings in the 60-80% level.
The charts and indicators continue to get weaker with both Indices rated as BEARISH on the intermediate term. The Qual-Silver Index is rated as – NEUTRAL on the long term while the Spec-Silver is still in the BULLISH camp.
MERV'S PRECIOUS METALS INDICES TABLE
Well, that's it for this week.
By Merv Burak, CMT
Hudson Aero/Systems Inc.
Technical Information Group
for Merv's Precious Metals Central
Web: www.themarkettraders.com
e-mail: merv@themarkettraders.com
During the day Merv practices his engineering profession as a Consulting Aerospace Engineer. Once the sun goes down and night descends upon the earth Merv dons his other hat as a Chartered Market Technician ( CMT ) and tries to decipher what's going on in the securities markets. As an underground surveyor in the gold mines of Canada 's Northwest Territories in his youth, Merv has a soft spot for the gold industry and has developed several Gold Indices reflecting different aspects of the industry. As a basically lazy individual Merv's driving focus is to KEEP IT SIMPLE .
To find out more about Merv's various Gold Indices and component stocks, please visit www.themarkettraders.com and click on Merv's Precious Metals Central . There you will find samples of the Indices and their component stocks plus other publications of interest to gold investors. While at the themarkettraders.com web site please take the time to check out the Energy Central site and the various Merv's Energy Tables for the most comprehensive survey of energy stocks on the internet. Before you invest, Always check your market timing with a Qualified Professional Market Technician
© 2005-2022 http://www.MarketOracle.co.uk - The Market Oracle is a FREE Daily Financial Markets Analysis & Forecasting online publication.