


Stock Market Extreme Bullish Sentiment
Stock-Markets / Stocks Bear Market Jun 07, 2009 - 01:49 PM GMTBy: Guy_Lerner

 As you would expect from the bullish price action last week, the "Dumb Money" indicator is moving to new extreme highs. Since 1991, this has been the 8th most extreme reading out of the 42 unique times the indicator went above the bullish extreme line (i.e., bear signal). Extreme readings, such as the current one, are generally associated with strong bull markets like those seen from 1995 to 1998 and from 2003 to 2004. The only real failure was in 2002, and this led to the flush into the July, 2002 lows.
The "Dumb Money" indicator is shown in figure 1. The "Dumb Money" indicator looks for extremes in the data from 4 different groups of investors who historically have been wrong on the market: 1) Investor Intelligence; 2) Market Vane; 3) American Association of Individual Investors; and 4) the put call ratio.
Figure 1. "Dumb Money"/ weekly
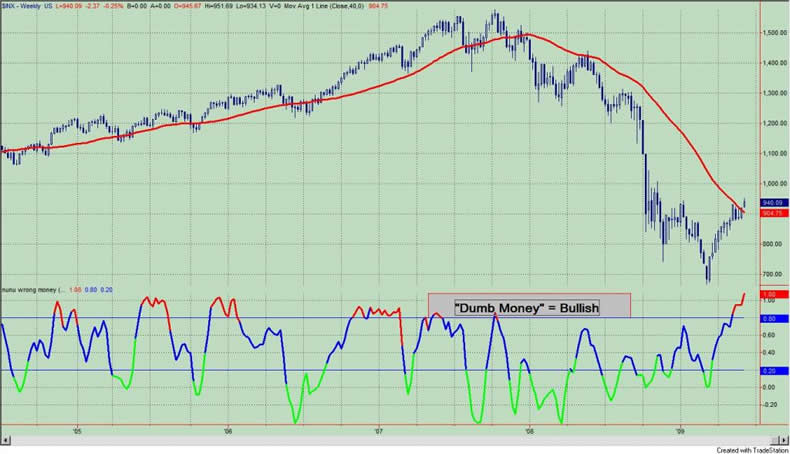
As I have pointed out over the past couple of weeks, it takes bulls to make a bull market, and the current dynamic -extreme bullish reading - is consistent with those times. For example, if you "bought" the S&P500 after similar extremes in the "Dumb Money" indicator and held your position for 13 weeks, 7 out of 8 of your trades would have been winners. 6 of the trades would not have lost more than 3.5% and the other two (1 winner and 1 loser) would not have lost more than 6.5% during the course of the trade. My interpretation of this limited data is the following: 1) we are in strong trending market and at this point, whether we label it a new bull market v. bear market rally doesn't matter; 2) dips will be bought even with a correction. In other words, if you bought today and held for 13 weeks it is unlikely that you would lose money in the end, and there is a real possibility of the markets being higher.
Now, let's slice and dice the extreme readings another way. In this instance, we will "buy" the S&P500 on a similar extreme reading in the "Dumb Money" indicator (as before), and we will sell our position when the "Dumb Money" indicator registers a bearish extreme reading (i.e., bull signal). In this way, we can see what happens to prices from the current point, extreme bullish value, to the next bearish value (or buy signal). In other words, would it be best to sit on the side lines (because we don't like to hold our noses and buy high and sell higher) and wait for the next buy signal (where we can buy low and sell higher)?
In this scenario, you have 6 trades; 4 were profitable. One trade lost more than 6.5% during the course of the trade and the 4 of the other 5 never lost more than 3%. While 4 trades were profitable, only 2 trades produced any meaningful profits; these were the trades from February, 1995 to July, 1996 (32% gain) and from May, 2003 to May, 2004 (18%) gain. Only 1 trade lost anything meaningful and that was the trade at the top of the 2002 bear market. This trade lost 6.5%.
So waiting for the "Dumb Money" indicator to cycle into the next buy signal (i.e, investor becomes bearish) may not be the best thing to do as there is the fear (and real possibility) of missing out on extra ordinary gains. With sentiment so bullishly extreme (and investors desirous of buying the dip), the market won't rollover so easily.
Of course, when it is comes to the markets, there is no free lunch, and we need to be ever mindful of the scenario like that seen in late 2001 and early 2002. The markets had a tremendous rally following the 9/11 disaster spiking 21% or so into the 40 week moving average in 13 weeks. The Fed had flooded the markets with liquidity, and the leading economic indicators showed an end to the recession, and prices on the S&P500 even closed above the simple 10 month moving average. Yet, despite all these fundamental and technical positives, the market rolled over by the end of April, 2002.
As I have stated over the past several months, I believe the current rally is a bear market rally; this is not the proper launching pad to a new bull market. Admittedly, the similarities between now and April, 2002 are striking, and honestly, this is my last "hope" that I will be vindicated. It's kind a looking like a bull market, but woops not so fast. We shall see. To me, the issue of bear market rally v. new bull market has yet to be resolved. I have outlined how I will manage such humiliation when and if it comes.
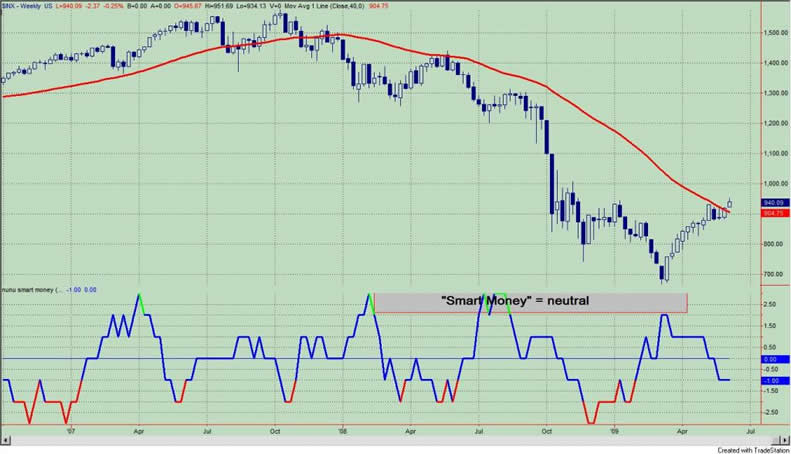
For the record, the "Smart Money" indicator is shown in figure 2. The "smart money" indicator is a composite of the following data: 1) public to specialist short ratio; 2) specialist short to total short ratio; 3) SP100 option traders.
Figure 2. "Smart Money"/ weekly
By Guy Lerner
http://thetechnicaltakedotcom.blogspot.com/
Guy M. Lerner, MD is the founder of ARL Advisers, LLC and managing partner of ARL Investment Partners, L.P. Dr. Lerner utilizes a research driven approach to determine those factors which lead to sustainable moves in the markets. He has developed many proprietary tools and trading models in his quest to outperform. Over the past four years, Lerner has shared his innovative approach with the readers of RealMoney.com and TheStreet.com as a featured columnist. He has been a regular guest on the Money Man Radio Show, DEX-TV, routinely published in the some of the most widely-read financial publications and has been a marquee speaker at financial seminars around the world.
© 2009 Copyright Guy Lerner - All Rights Reserved
Disclaimer: The above is a matter of opinion provided for general information purposes only and is not intended as investment advice. Information and analysis above are derived from sources and utilising methods believed to be reliable, but we cannot accept responsibility for any losses you may incur as a result of this analysis. Individuals should consult with their personal financial advisors.
Guy Lerner Archive |
© 2005-2022 http://www.MarketOracle.co.uk - The Market Oracle is a FREE Daily Financial Markets Analysis & Forecasting online publication.