


Leading Economic Indicators, S&P 500, and 10 Month Moving Average
Stock-Markets / Stocks Bear Market Jun 09, 2009 - 07:04 AM GMTBy: Guy_Lerner

 Over the past month I have highlighted the strategy attributed to Mebane Faber. It is a simple but elegant strategy that probably gets more merit for its aversion to risk than its ability to time the exact bottom of a bear market. It is a strategy - a way of executing a plan of when to buy and sell. It is not a "call" or opinion on the market. That stuff I will leave to others.
I have adopted the strategy as a back stop just in case I have got it wrong. You see, I believe that the current rally from early March is a bear market rally and that this isn't the launching pad to a new bull market. So a monthly close over the simple 10 month moving average has become my arbitrary line in the sand to say, "Yes, I got it wrong".
Interestingly, the Economic Cycle Research Institute's Leading Economic Indicator (LEI), which is constructed from numerous fundamental variables, is now above its simple 10 month moving average. The LEI is about 60% correlated with the S&P500. So let's see if the LEI, which is a good barometer of economic activity, can add any value to the Faber model.
In all the models discussed in this article, I will be using monthly data on the S&P500 (or LEI) with a starting date of September, 1970. From this time period to the present day, the S&P500 has gained approximately 850 points. This is our buy and hold bogey. Slippage and commissions are not considered, and I am not considering any interest earned when the strategies are in cash.
The variables that I am assessing are in Table 1 and may require some explanation. The maximum MAE refers to "maximum adverse excursion". MAE is the amount in percentage terms you had to see a trade go against your entry price before the trade was closed out. MAE represents that period of self doubt when you ask yourself if you really have this one right. The bigger the MAE the more self doubt and loss you are likely to have. The other term is the RINA index. The RINA index is a measure of risk constructed from the strategy's points gained, draw down and time in the market. The higher the number the better, and ideally, we want a strategy to gain a lot of points with as little draw down as possible and within as little market exposure as possible. RINA is a measure of trade efficiency.
The Models
The Faber model is to buy the S&P500 on a monthly close over the simple 10 month moving average; the sell strategy is to sell on any monthly close below the simple 10 month moving average.
The second model is to buy the S&P500 when the LEI closes above its simple 10 month moving average; the sell strategy is to sell the S&P500 when the LEI close below its simple 10 month moving average.
The third model is to buy the S&P500 when both the LEI and S&P500 are above their simple 10 month moving average; the sell strategy is to sell the S&P500 when both the LEI and S&P500 are below their simple 10 month moving average.
The fourth model is to buy the S&P500 when both the LEI and S&P500 are above their simple 10 month moving average; the sell strategy is to sell the S&P500 when either the LE or S&P500 close below the simple 10 month moving average.
The fifth model is to buy the S&P500 when both the LEI and S&P500 are above their simple 10 month moving average; the sell strategy is to sell the S&P500 when only the S&P500 closes below its simple 10 month moving average.
Now let's look at Table 1. For the most part, adding the LEI model to the Faber model provides little value. The Faber model still has the most points gained and with the highest RINA index, it is the most efficient strategy. Adding the LEI does seem to improve the winning percentage and therefore, the LEI may prove to be an additional filter for the Faber model. The best exit strategy is the one based upon price - a monthly close by the S&P500 below its 10 month moving average.
Table 1. Strategies
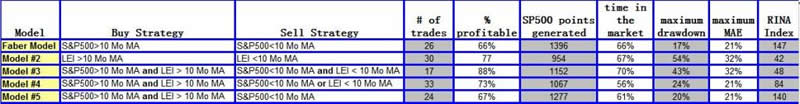
The Faber model provides a simple methodology to participate in the market. Its greatest asset, I believe, is risk aversion and the sell strategy. Referring back to the table, note that draw downs in excess of 40% were seen in the strategies involving LEI as an exit signal. The Faber sell signal, a close by the S&P500 below its simple 10 month moving average, led to draw downs from the 17% to 24% range. Despite the "wonders" or "magic" of the simple 10 month moving average, there are risks to this strategy as noted by the high MAE and modest draw down.
By Guy Lerner
http://thetechnicaltakedotcom.blogspot.com/
Guy M. Lerner, MD is the founder of ARL Advisers, LLC and managing partner of ARL Investment Partners, L.P. Dr. Lerner utilizes a research driven approach to determine those factors which lead to sustainable moves in the markets. He has developed many proprietary tools and trading models in his quest to outperform. Over the past four years, Lerner has shared his innovative approach with the readers of RealMoney.com and TheStreet.com as a featured columnist. He has been a regular guest on the Money Man Radio Show, DEX-TV, routinely published in the some of the most widely-read financial publications and has been a marquee speaker at financial seminars around the world.
© 2009 Copyright Guy Lerner - All Rights Reserved
Disclaimer: The above is a matter of opinion provided for general information purposes only and is not intended as investment advice. Information and analysis above are derived from sources and utilising methods believed to be reliable, but we cannot accept responsibility for any losses you may incur as a result of this analysis. Individuals should consult with their personal financial advisors.
Guy Lerner Archive |
© 2005-2022 http://www.MarketOracle.co.uk - The Market Oracle is a FREE Daily Financial Markets Analysis & Forecasting online publication.