


Weekly Gold and Silver Technical Analysis Report - 3rd June 2007 - Technically Precious with Merv
Commodities / Gold & Silver Jun 03, 2007 - 10:56 AM GMTBy: Merv_Burak

A bounce off the long term moving average line and it looks like more smiles ahead. What could go wrong? We'll soon know if anything.
GOLD: LONG TERM
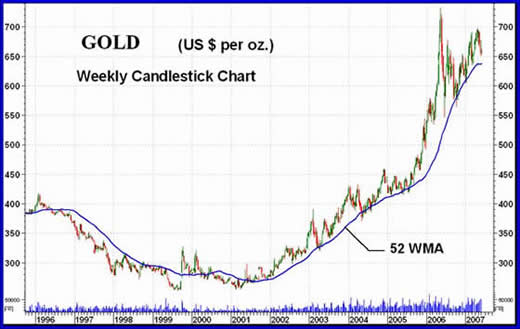
The chart shows the bear and bull markets in gold during the past 11 years or so. Prior to 1996 gold was at $500 in late 1987 (remember THAT year?) and declined to the $330 level by early 1993. A small rally and a few years of lateral activity and we get to the 1996 top shown here. We are at levels that have only been exceeded for a very few weeks back in 1980. The all time high at that time was $875 but depends upon the data one uses for their information. This bull market is by far the strongest bull we have seen since gold moved from the $100 level in mid-1976 to its top at $875 in early 1980. This bull is tracing a trend much slower than the one in the late 1970's. The 1970's bull took only three and a half years to complete. This one is already at year 6 (or 8, depending upon which bottom one uses). To equal the same % gain of that earlier bull this bull would have to move well into the $2000 range. That would be a great move but here we take things one step at a time.
Nothing has changed in the long term P&F chart during the week so we are still in a long term P&F bull market with no immediate end in sight.
As for the usual indicators, well the price is bouncing off my long term positively sloping moving average line (see intermediate term chart below) and the long term momentum indicator is once more pointing upward inside its positive zone. As for the volume indicator, it is still just a shade below its trigger line but the trigger line is still pointing slightly upward. All in all, I am going back to the BULLISH side from last week's neutral.
INTERMEDIATE TERM
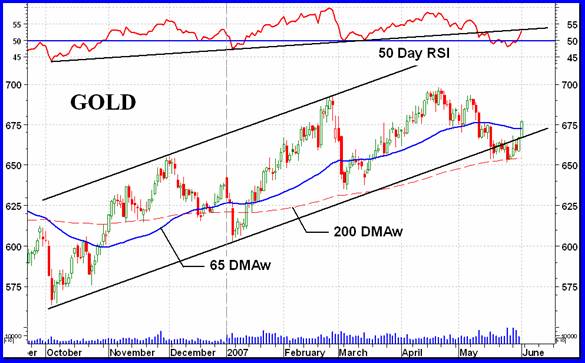
Last week I mentioned that the intermediate term P&F chart was in a bearish trend. Despite some upward movement on the chart it is still bearish. More movement needs to take place before it can go bullish.
As the above chart shows, the sharp turn at the end of the week took the price of gold back into the previous up trending channel. Now we just need to see if it stays there. The move had also taken the price above its moving average line with the line turning up on Friday. The momentum indicator is also back inside its positive zone after toying with the negative zone these past few weeks. However, momentum is still slightly below its up trending line that was the lower line of an up trending channel. Another positive week and it too will be back inside its channel. The volume indicator is still the weak link in the intermediate term indicators. It is still below a negative sloping trigger line.
Despite the volume indicator and the P&F chart I am inclined to go back into a more positive mode but not yet all out bullish. For this week I'm going only to the + NEUTRAL level, just short of bullish.
SHORT TERM
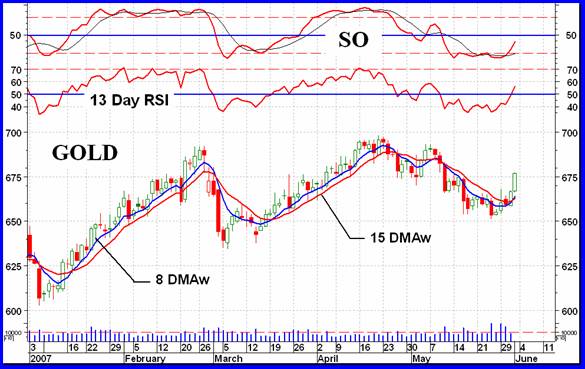
Looks like everything is on the side of a short term rally. The price has moved above the short term moving average line and the line turned up on Thursday. Thursday's close was above my turn around price mentioned last week. Momentum has been gaining strength and has now moved into the positive zone. The overwhelming odds are for a continuation of the rally. That's not to say that there may not be some bummers along the way but from the performance over the past year or so, when the short term moving average line turns up we are into a rally that might last for a couple of weeks or longer. A trend reversal price is difficult to assess at this time but I would be inclined to reverse back to the negative, short term wise, if the price closed below $657.50 using the August futures trading data.
IMMEDIATE TERM
The flip of the coin says that we should be in for a few more upside days ahead. The price is above a positive very short term moving average line and the Stochastic Oscillator has broken above its oversold line and trigger line although still slightly below the neutral line. The direction is to the up side so that is the way we will go, i.e. go with the trend in motion. I would worry if the price closed below Friday's low, below $666.00.
NORTH AMERICAN GOLD INDICES
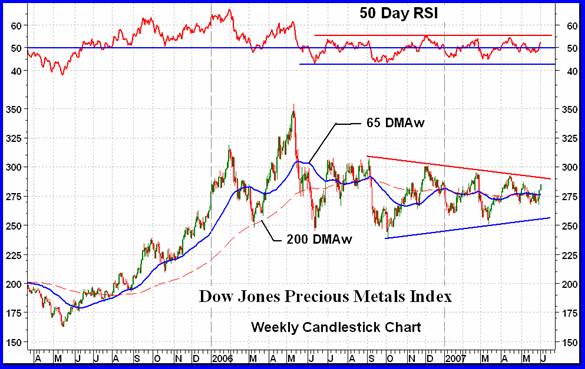
I mentioned last week the inclusion of the Dow Jones Precious Metals Index into the Gold Indices Table along with its inclusion into the regular rotated major Indices that are looked at each week in this section. Well, here it is in living color. It is much like the other major Indices reviewed here each week. We have that head and shoulder pattern with the elongated right shoulder, a year long lateral trend taking place well below the early 2006 high and an intermediate term momentum indicator that is bouncing above and below its neutral line confirming the lateral undecided trend of the price. We also have a backward megaphone pattern. There is suppose to be some significance to this pattern but I am inclined to follow the more normal indicators and patterns rather than look for meaning in these rare patterns.
It does look like the trend is towards a breaking of the upper megaphone trend line which would be a positive, especially so if accompanied by a move by the momentum indicator above its resistance level. The more important move would be a close above the 310 level on the up side. That could just start a move that could take us, finally, into new highs. But let's not get too far ahead of ourselves. That head and shoulder pattern, although weird looking, is still a valid pattern and must be nullified by a move to new highs. Until then it is a worry.
MERV'S PRECIOUS METALS INDICES
All in all it was a very good week for the precious metals. Most of the major Indices were up around the 5% mark while the Merv's Indices were all over the place with a low of 2.7% and a high of 5.2%. One week does not a trend make but it helps towards eventually making one. We still have that solid potential double top in place and it would still take a few good weeks to overcome it. The Composite Index of Precious Metals Indices is still below its intermediate term moving average line but the intermediate term momentum has moved back above its neutral line. Long term things still look okay.
MERV'S GOLD & SILVER 160 INDEX
To understand what's happening in the precious metals stock market one first looks in on the universe of 160 gold and silver stocks. Here, the average of the 160 stocks was an increase of 3.2%. This is less than what the major Indices are showing. From a look at the sectors one finds that the “quality” group did well while the speculative group was the worst loser. Since most of the stocks in the universe may be classified as speculative this provides the answer why the Index had a poor relative performance. Looking at the winners and losers, there were 111 winners (69%) and 43 losers (27%), a good ratio but still suggesting that the winners were not that great otherwise with such a ratio the overall Index gain should have been a lot higher.
Although the overall summation of individual ratings improved for all time periods such improvement still requires another week or two for the ratings to move into the bullish camp. On the short term the summation of ratings gives us a NEUTRAL rating with neither bull nor bear in the above 50% level (last week this rating was 78% bearish). On the intermediate term the rating is now 51% BEARISH (last week it was 69% bearish). On the long term we are NEUTRAL, again with no bull or bear above 50%. Last wee we were at a bearish 54%. So, all moved closer towards the bull rating but not quite there yet.
With the intermediate term momentum indicator bouncing up off its neutral line and the Index still below a negative moving average line I would classify the chart as being NEUTRAL at the present time. One more week and the intermediate term should go bullish. On the long term things are more settled. Momentum continuing in the positive zone and the Index still above its positive moving average line for a BULLISH rating of the chart.
MERV'S QUAL-GOLD INDEX : MERV'S SPEC-GOLD INDEX : MERV'S GAMB-GOLD INDEX
The overall universe is one thing, the sectors are another. Not all stocks move together. Here we see which are the movers and which are not. As far as the Indices themselves are concerned the Qual took the prize with a gain of 5.1%. The Spec was the bummer with a 2.7% gain and the Gamb was in between with a 4.7% gain. As for winners and losers, that's a different story. Here we see the natural order of things with the quality having the best performance, the Spec next and the Gamb at the bottom. There were 30 gainers in the Qual sector, that's 100%. In the Spec sector we had 23 gainers (77%) and 6 losers (20%). In the Gamb sector we had 18 gainers (60%) and 10 losers (33%). As with the universe, as far as the movement of the overall summation of ratings was concerned, that movement was generally towards the positive but only one rating changed from the bear to the bull. The short term rating for the Qual Index moved into the BULL side with a 53% rating. All others remained in the bearish camp or moved into the neutral. Next week, if a positive week, should see more of the ratings move into the bullish side.
The Qual and Spec Indices are still below their intermediate term moving average lines and both are still pointing lower. All else are in the positive zone for the indicators. The intermediate term Qual and Spec are considered BEARISH at this time while the other time periods and/or Indices are still considered as BULLISH.
SILVER
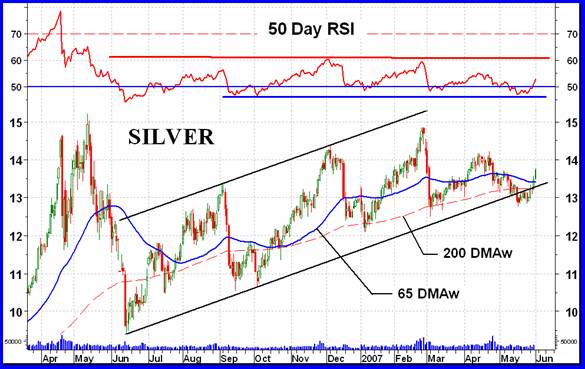
After a couple of weeks out of the channel silver has once more moved inside. So, its bearish break has been nullified for now. Although the short term trend is now positive and the other ratings may be considered as bullish, silver still has some ways to go to REALLY be on the move again. The initial hurdle will be that high from April. In the end Silver must make a new high by breaking through that $15 barrier. Once through there the sky will be the limit. That would put us into a 26 year high area. Next would be an assault on the all time high reached in early 1980, along with gold, in the low $40 area.
QUAL-SILVER INDEX : SPEC-SILVER INDEX
With silver advancing by 5.7% on the week it's not surprising that the silver Indices had good weeks. It is, however, surprising that they didn't do better than they did. The Qual-Silver Index advanced by 5.2% while the Spec-Silver advanced 4.3% on the week. One would have expected a multiply advance versus silver. Along with their advance the Qual-Silver had 9 out of its 10 stocks advancing for a 90% gain while the Spec-Silver had only 18 advancers for 72% on the plus side. Despite the gains none of the summations of individual ratings moved into the bullish category although they all moved towards the positive side.
Looking at the charts and indicators for the two Indices we get ratings based upon the indicators as BEARISH for the Qual-Silver intermediate term and BULLISH for the other periods for both Indices.
MERV'S COMPOSITE INDEX of NON-EDIBLES FUTURES INDICES
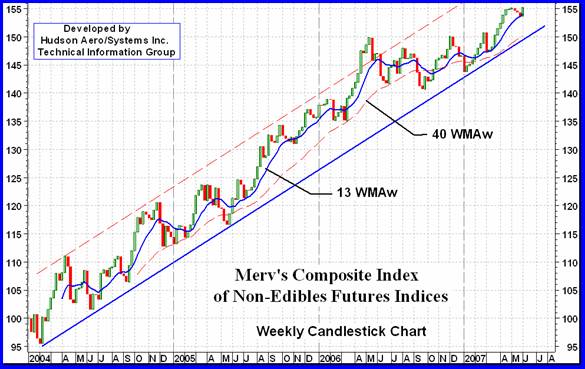
Just another interesting chart.
This Index is a composite Index of the following futures Indices; Metals, Energies, Currencies, Indices and Financials, 26 Indices in all. It is interesting that although one group or another goes through periods of bearish activity overall the Composite shows a steady bullish market for them as a combination. Except for a brief period in mid-2006, the Composite Index has kept inside a tight channel and seems now to be heading towards the upper channel line again. One needs to go to the Table of Non-Edibles Futures Indices to understand which Indices are on the up side move and which are lagging.
MERV'S PRECIOUS METALS INDICES TABLE
Well, I think I'll call it another week.
By Merv Burak, CMT
Hudson Aero/Systems Inc.
Technical Information Group
for Merv's Precious Metals Central
Web: www.themarkettraders.com
e-mail: merv@themarkettraders.com
During the day Merv practices his engineering profession as a Consulting Aerospace Engineer. Once the sun goes down and night descends upon the earth Merv dons his other hat as a Chartered Market Technician ( CMT ) and tries to decipher what's going on in the securities markets. As an underground surveyor in the gold mines of Canada 's Northwest Territories in his youth, Merv has a soft spot for the gold industry and has developed several Gold Indices reflecting different aspects of the industry. As a basically lazy individual Merv's driving focus is to KEEP IT SIMPLE .
To find out more about Merv's various Gold Indices and component stocks, please visit www.themarkettraders.com and click on Merv's Precious Metals Central . There you will find samples of the Indices and their component stocks plus other publications of interest to gold investors. While at the themarkettraders.com web site please take the time to check out the Energy Central site and the various Merv's Energy Tables for the most comprehensi
© 2005-2022 http://www.MarketOracle.co.uk - The Market Oracle is a FREE Daily Financial Markets Analysis & Forecasting online publication.