


Rising US Bond Yields - The Big Picture
Interest-Rates / US Bonds Jun 21, 2007 - 08:12 PM GMTBy: Marty_Chenard

We have had a lot of inquiries about rising bond yields because they have been making the market jittery. So this morning we will do an in depth look at the 30 year bond yields to show you what significant event has happened and what the current situation looks like.
Chart 1: First, let's look at the big picture on bond yields from 1999 to June 2007.
After being in a down trend for 8 years, 30 year bond yields broke through an important resistance line. You can see how that resistance was penetrated on June 7th. What is significant, is that yields "gapped up" over that resistance. When it broke through, it broke through with a fury and had two more gap up's on its ascent. This tells you that there has been a serious change in the bond markets.
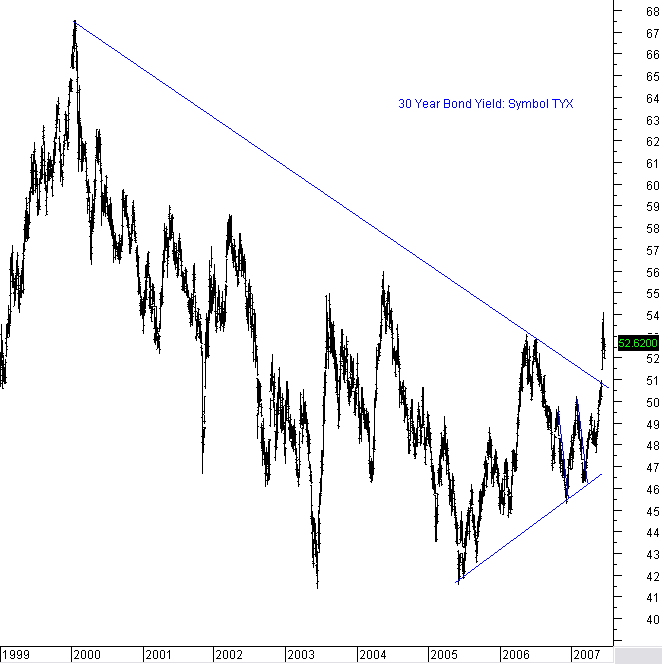
Chart 2: During the last 8 years, there were only 2 prior times that the 30 RSI on bond yields reached a reading above 70. Each of those occurrences depicted a peak, over extended condition where yields then reversed back down.
On June 12th., we had the 3rd. such occurrence when the RSI reached 75 and then reversed back down the next day.
So ... what happens now? On the current pull back, we closed two of the gaps. The question is whether the first gap gets closed and bond yields test the new 8 year support line.
It may not ... If you look at the Relative Strength indicator at the top of the graph, it is still positive and has made higher tops and higher bottoms. If it holds the support line that I drew, the RSI would then make a higher bottom again and bond yields would rise further from there.
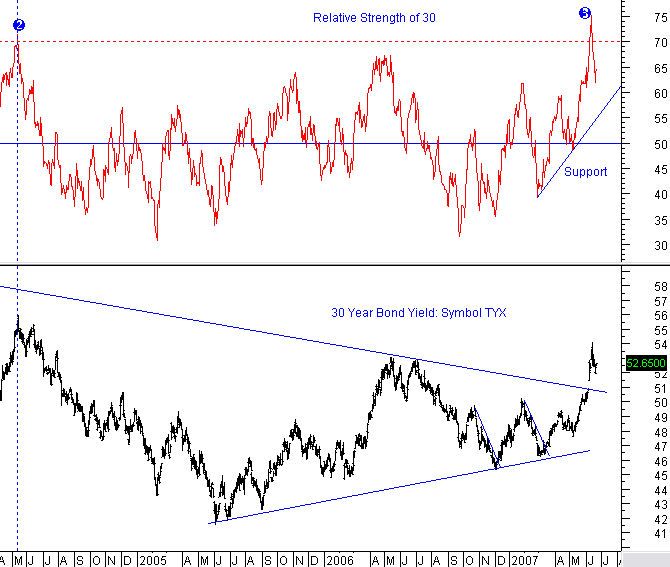
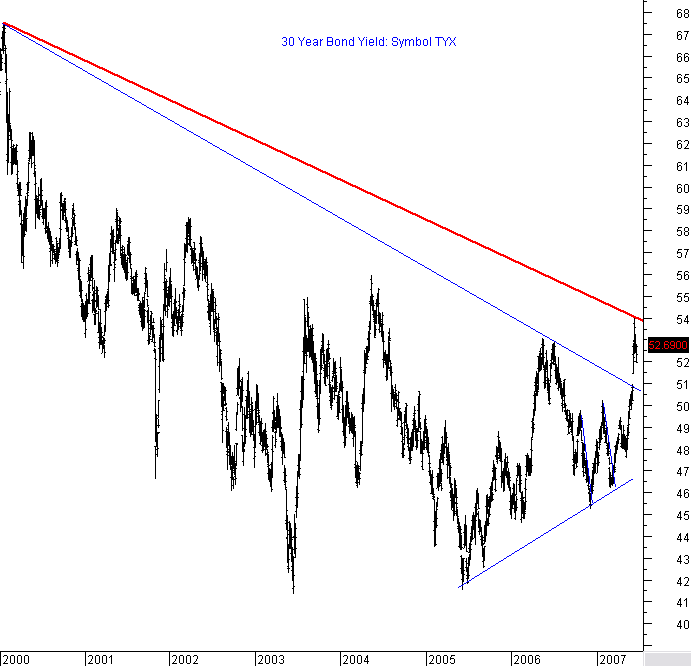
Chart 3: Many are comfortable saying that the markets can live with the current level of yields. Maybe so, but it is creating a lot of stress and higher Volatility levels.
When do we hit a panic level on the 30 Year Bond Yields? The next chart shows you when ...
On this chart, I drew a second (RED) fan line from the bond yield high on the left. If the 30 year bond yield rises above this red resistance line (also known as a fan line), then there will likely be a panic reaction in the bond market and the stock market.
You don't have to know when of if it will happen. You can watch it real time every day by drawing your own red resistance line from the January 20th., 2000 intra-day high to the June 13th. 2007 intra-day high. Then, just watch the TYX for when it breaks through that level. When it does, the markets will have a serious issue to resolve. The Fed will do everything they can to not let it get to this level, but they may not have the power "they think they have" in being able to stop it.
If you want to send a link to this page to a friend, I have provided a quick and easy way to do it below this chart.
Do you have a friend or fellow investor that you think would appreciate receiving a link to the this page of Today's Analysis"?
If so, simply click on the link to the right to quickly and easily forward an email link . It is completely private, so we won't even know if you send one. Send This Page To a Friend
By Marty Chenard
http://www.stocktiming.com/
Please Note: We do not issue Buy or Sell timing recommendations on these Free daily update pages . I hope you understand, that in fairness, our Buy/Sell recommendations and advanced market Models are only available to our paid subscribers on a password required basis. Membership information
Marty Chenard is the Author and Teacher of two Seminar Courses on "Advanced Technical Analysis Investing", Mr. Chenard has been investing for over 30 years. In 2001 when the NASDAQ dropped 24.5%, his personal investment performance for the year was a gain of 57.428%. He is an Advanced Stock Market Technical Analyst that has developed his own proprietary analytical tools. As a result, he was out of the market two weeks before the 1987 Crash in the most recent Bear Market he faxed his Members in March 2000 telling them all to SELL. He is an advanced technical analyst and not an investment advisor, nor a securities broker.
Marty Chenard Archive |
© 2005-2022 http://www.MarketOracle.co.uk - The Market Oracle is a FREE Daily Financial Markets Analysis & Forecasting online publication.