


Treasury Bonds Signal Inflation Pressures Moderating
Interest-Rates / US Bonds Dec 01, 2009 - 01:08 AM GMTBy: Guy_Lerner

 The composite indicator that measures the trends in gold, crude oil, and yields on the 10 year Treasury has moderated significantly. See figure 1 a weekly chart of the S&P500 with the indicator in the lower panel.
Figure 1. S&P500/ weekly
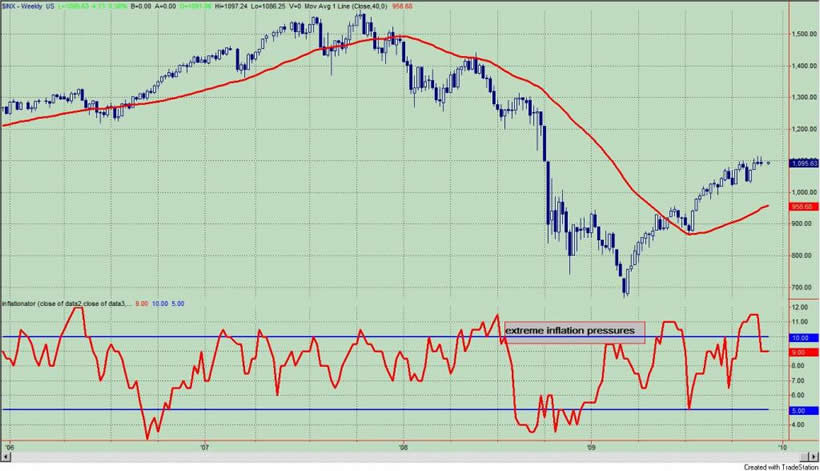
During the past 6 weeks when the indicator was in the extreme zone, the S&P500 gained about 4 points - a headwind indeed. On the other hand, when we apply the indicator as a filter (see this article: "The Faber Model And Inflation Pressures") for the Faber model, which uses monthly data, you would have exited the S&P500 at the end of October and missed the 5.5% gain in November. I guess you can call that the vagaries of systematic trading as the monthly time frame may produce different results than the weekly.
Regardless of your chosen time frame, we now have a buy signal as the indicator is no longer extreme and prices are above their 40 week or 10 month simple moving averages. In the original article referenced above, we showed that we could significantly improve the efficiency of the Faber model, which uses monthly data for the S&P500, when prices were above the simple 10 month moving average and the indicator was not in the extreme zone. By efficiency, I meant the Faber model plus filter made more money with less time in the market and with less draw down to capital.
These efficiencies are also true when we use the composite inflation indicator as a filter in a simple strategy that uses the 40 week simple moving average to trade the S&P500. For example, the modified strategy (40 week simple moving average plus filter) yields about 50% more points than the moving average system alone with 50% less time in the market. I have yet to present this data, but the purpose of this article isn't to share a trading system with you. I will put that together over the next couple of days. I really wanted to let you know that there was:
1) a moderation of inflation pressures;
2) this represents a buy signal with our modified Faber model;
3) this signal is going to be at odds with data that I will present in a couple of days that suggests that the markets are at an important inflection point. I have been writing about this for weeks, and there is a high likelihood of much lower prices. The outlier trade remains the blow off top, and we will know that this is occurring if prices on the major indices and important ETF's break out of their current price range. It seems stupid to say that we will have higher prices when prices break out but being that this is the low odds outcome, I cannot wholeheartedly endorse a strategy until it happens.
But I would encourage you to go back to the article written on November 16 entitled "Just Sell Something, Please". Look at the table in the bottom graph and see how many of those ETF's are trading above the highs of those negative divergence bars. GLD and SLV remain above, but FXI and QQQQ are back below, and EEM has yet to move above its range. To me, this spells trouble for the markets until it doesn't. Furthermore, we are starting to see more ETF's with multiple negative divergences.
I will go over all this in the week ahead and provide you with several ways to navigate this very tricky market, and to deal with data that is at odds.
By Guy Lerner
http://thetechnicaltakedotcom.blogspot.com/
Guy M. Lerner, MD is the founder of ARL Advisers, LLC and managing partner of ARL Investment Partners, L.P. Dr. Lerner utilizes a research driven approach to determine those factors which lead to sustainable moves in the markets. He has developed many proprietary tools and trading models in his quest to outperform. Over the past four years, Lerner has shared his innovative approach with the readers of RealMoney.com and TheStreet.com as a featured columnist. He has been a regular guest on the Money Man Radio Show, DEX-TV, routinely published in the some of the most widely-read financial publications and has been a marquee speaker at financial seminars around the world.
© 2009 Copyright Guy Lerner - All Rights Reserved
Disclaimer: The above is a matter of opinion provided for general information purposes only and is not intended as investment advice. Information and analysis above are derived from sources and utilising methods believed to be reliable, but we cannot accept responsibility for any losses you may incur as a result of this analysis. Individuals should consult with their personal financial advisors.
Guy Lerner Archive |
© 2005-2022 http://www.MarketOracle.co.uk - The Market Oracle is a FREE Daily Financial Markets Analysis & Forecasting online publication.