


Stocks Bear Market Rally Dow Theory Update
Stock-Markets / Stocks Bear Market Jun 14, 2010 - 09:15 AM GMTBy: Tim_Wood

 I continue to receive questions regarding Dow theory and whether or not a so-called "sell signal" has been triggered. Technically, with Dow theory there is no such thing as a buy or sell "signal." Rather, the Dow theory founding fathers anticipated trend changes and during these periods of such participation they would begin to establish their positions ahead of the anticipated trend change. They referred to these periods of anticipation as "buy and sell spots."
Then, once the trend change occurred, that served as confirmation of the "buy and sell spots." Because there are very few original writings by our Dow theory founding fathers and because much of what is written is so often incorrect, most people today have misunderstood the orthodox Dow theory trend changes as being a Dow theory "buy or sell signal." In accordance with orthodox Dow theory, this is not correct.
With Dow theory, it is the close that counts. The intraday highs and lows are of no consequence with Dow theory what so ever. Also, in accordance with Dow theory the previously established trend is considered to be in force until it is properly reversed and proper reversal requires a joint move above or below the previous secondary high or low points. Since it is a bearish primary trend change that everyone seems to be focused on, proper reversal will require a joint move, on a closing basis, below the previous secondary low points.
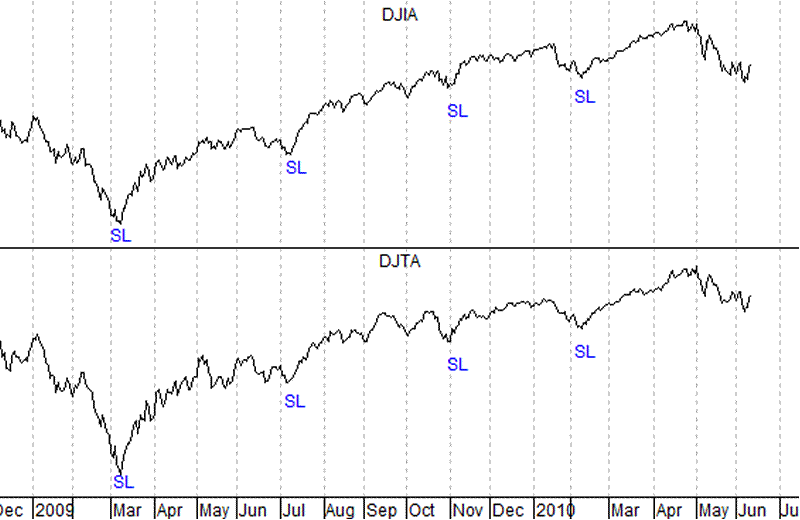
Based on my read of Dow theory, this has not yet occurred. Based on my read of Dow theory, the April highs marked the last secondary high points and the February lows marked the last secondary low points. The decline that has followed the April high into the early May closing lows as well as the late May closing lows were are all part of the same move. In other words, I do not see any of the lows between the April top and the current low as qualifying to have marked new secondary low points. My read is that the new secondary low points are still in the process of being established. Now, it is possible that the June 7th closing lows marked the most recent secondary low points, but at this time this has not yet been confirmed. I will be covering this in detail as it develops at Cycles News & Views, but for now, there is insufficient evidence to make that determination. Anyway, since we have yet to see a joint decline below both previous secondary low points, a bearish primary trend change has not yet occurred. The current Dow theory chart can be found below.
Now, with this all being said and based on the data at hand today, I believe that once the pending secondary low points are established the pending rally will constitute what our Dow theory founding fathers would have termed a "sell spot." I will also be covering these developments in great detail as they unfold at Cycles News & Views. It will then be what develops from that point that will be key. I have statistical data, specific "DNA Markers" and indicators that will help us identify and understand the developments as they occur. For the record, I do anticipate a Dow theory trend change later this year. However, we must understand the meaning of the price behavior in the interim in order to know if the anticipated sell spot is still developing and whether or not the anticipated trend change is still on track or if something has developed to change that expectation.
I have again included a chart of the Dow Jones World Stock Index below and it continues to be weak. This index peaked in November 2007 and like the Industrial and the US markets, I believe that most of the world stock averages also fell into their Phase I low in the late 2008 to early 2009 timeframe.
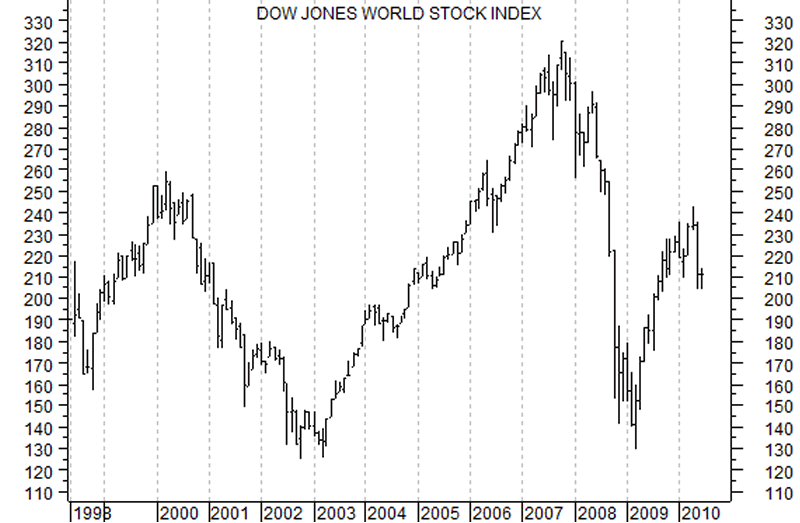
Like the U.S. markets, I continue to believe that most foreign markets have also been in bear market rallies since those lows were established. I have said for years that the deflationary forces of K-wave winter are a global phenomenon and the credit issues that have surfaced overseas serve to prove that correct. Once the bear market rallies separating Phase I from Phase II of the ongoing secular bear market are properly setup in accordance with the proper DNA Markers, the stage will be set for the Phase II deflationary decline to set in. This last week I heard a good bit of talk about a double dip recession and that perhaps this explains the current woes of the market. That analysis is not correct. This is one large ongoing recession that will become much worse and much more than a simple recession. Since early 2009 we have seen just enough relief for the masses to think that is it over. My read is that we have been in the eye of the storm and that we now have to ride out the rest of the storm. In this case, that storm is K-wave winter and its deflationary forces as well as the Phase II bear market decline for equities.
I have begun doing free Friday market commentary that is available at www.cyclesman.info/Articles.htm so please begin joining me there. The specifics on Dow theory, my statistics, model expectations, and timing are available through a subscription to Cycles News & Views and the short-term updates. I have gone back to the inception of the Dow Jones Industrial Average in 1896 and identified the common traits associated with all major market tops. Thus, I know with a high degree of probability what this bear market rally top will look like and how to identify it. These details are covered in the monthly research letters as it unfolds. I also provide important turn point analysis using the unique Cycle Turn Indicator on the stock market, the dollar, bonds, gold, silver, oil, gasoline, the XAU and more. A subscription includes access to the monthly issues of Cycles News & Views covering the Dow theory, and very detailed statistical based analysis plus updates 3 times a week.
By Tim Wood
Cyclesman.com
© 2010 Cycles News & Views; All Rights Reserved
Tim Wood specialises in Dow Theory and Cycles Analysis - Should you be interested in analysis that provides intermediate-term turn points utilizing the Cycle Turn Indicator as well as coverage on the Dow theory, other price quantification methods and all the statistical data surrounding the 4-year cycle, then please visit www.cyclesman.com for more details. A subscription includes access to the monthly issues of Cycles News & Views covering the stock market, the dollar, bonds and gold. I also cover other areas of interest at important turn points such as gasoline, oil, silver, the XAU and recently I have even covered corn. I also provide updates 3 times a week plus additional weekend updates on the Cycle Turn Indicator on most all areas of concern. I also give specific expectations for turn points of the short, intermediate and longer-term cycles based on historical quantification.
Tim Wood Archive |
© 2005-2022 http://www.MarketOracle.co.uk - The Market Oracle is a FREE Daily Financial Markets Analysis & Forecasting online publication.